thilmera7

 (5 votes, average: 4.80 out of 5)
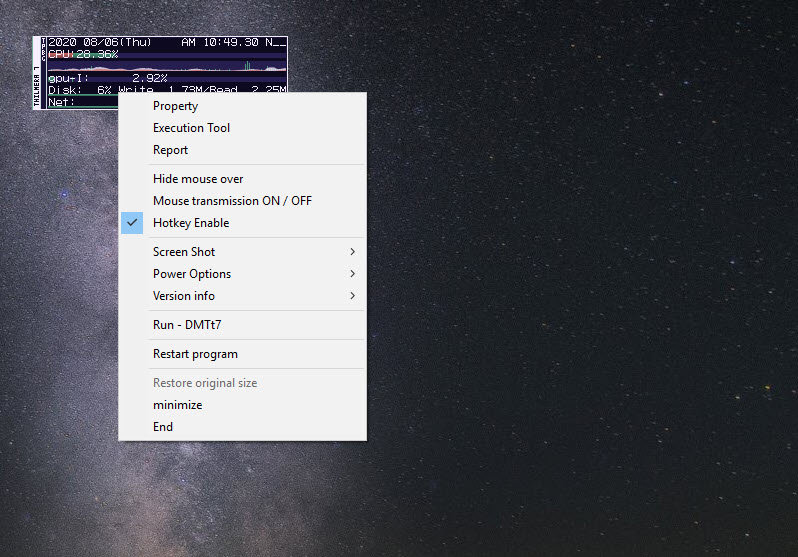
About thilmera7
thilmera7 is the system monitor that puts a compact widget on your desktop showing exactly what your hardware is doing in real time. The widget displays CPU usage per core with frequency and temperature, GPU usage with VRAM consumption and temperature, RAM usage with available and total figures, disk activity with read and write speeds, network throughput with upload and download rates, and various other system metrics that give you constant visibility into how your computer is performing without opening Task Manager every few minutes.
The display sits in a configurable position on screen (typically a corner or edge), updates several times per second, and uses minimal resources itself so monitoring doesn’t degrade the performance you’re trying to monitor.
The application has been developed independently since 2001 by Japanese developer Gakuto Matsumura, with the 7 in the name referring to the major version line rather than the operating system version. Across more than two decades, the application has accumulated capabilities that go substantially beyond basic resource monitoring. NPU monitoring for systems with neural processing units. Per-process detail when you need to identify what’s consuming resources.
Audio level meters showing sound input and output activity. Weather forecast integration. Cryptocurrency price tickers. Custom display panels you configure for your specific monitoring priorities. The application is free without paid tiers gating core functionality, with active development continuing through regular updates that add features and refine performance.
For users who want constant system visibility through a customizable dashboard rather than periodic check-ins through built-in tools, this software covers ground that simpler monitors don’t reach.
The compact widget interface
The widget itself is what most users interact with daily. By default, it appears as a small dark panel showing the most important metrics in a tight vertical or horizontal layout depending on configuration. Each line shows one metric with its current value, often with a small graph showing recent history alongside the numeric reading. The visual density is high, with substantial information packed into a small screen footprint, but the design keeps everything readable through careful typography and color choices.
The widget position is fully configurable. Pin it to a screen corner where it stays out of the way of normal work. Place it along an edge for a thin always-visible strip. Position it specifically on a secondary monitor if you have one, dedicating the second screen partly to monitoring while the primary screen handles work.
Multiple widget instances work for users who want different metrics displayed in different positions, with each instance configurable independently.
The transparency and visual style controls let you tune how visible the widget is against your background. Fully opaque produces maximum readability at the cost of completely blocking whatever’s behind it. Semi-transparent lets you see through the widget to your desktop while still reading the metrics. Various color schemes adapt to dark themes, light themes, or custom color preferences. For users who want monitoring without aesthetic disruption, these tuning options matter.
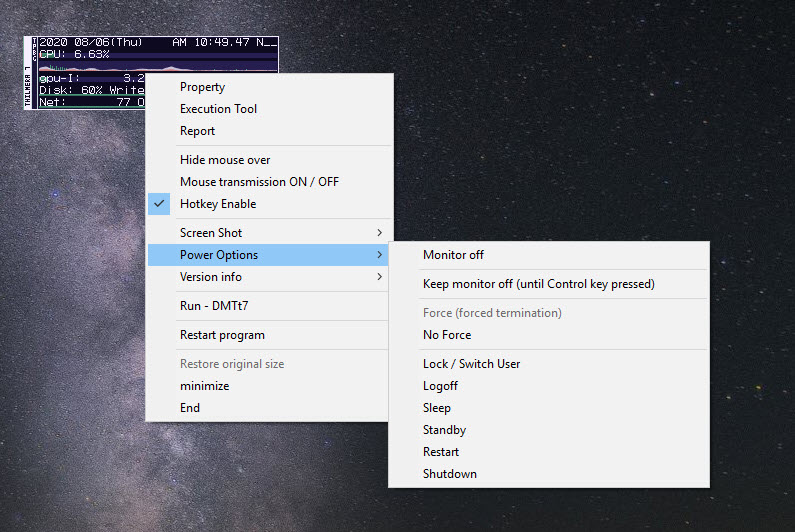
The widget responds to mouse interaction with right-click menus that expose configuration, hover tooltips that show additional detail beyond what fits in the main display, and click actions you can configure to trigger specific behaviors. The interaction model matches what desktop widgets traditionally provide rather than requiring you to leave whatever you’re doing to access controls.
CPU, GPU, and per-core monitoring
The CPU monitoring shows usage per logical core rather than just an aggregated total. Modern multi-core processors might show very different loads across their cores, with one core running at 100% while others sit nearly idle. The aggregated total that simpler monitors show would just average to maybe 25% across an 8-core CPU, hiding the fact that one core is fully loaded. Per-core display reveals these patterns clearly, which helps when diagnosing single-threaded workloads that bottleneck specific games or applications.
The CPU temperature reading uses sensors that the operating system exposes, with the application supporting various sensor implementations across different motherboard manufacturers. Frequency monitoring shows the actual current operating frequency rather than the rated base frequency, which matters because modern CPUs constantly adjust their frequency based on workload and thermal conditions. Watching the frequency reading helps confirm that thermal throttling isn’t kicking in during demanding tasks.
The GPU monitoring covers usage percentage, VRAM consumption, GPU temperature, and (on supported hardware) GPU frequency and power consumption. For users running games, video rendering, or AI workloads, the GPU metrics matter as much or more than CPU metrics. Watching the VRAM usage during gaming reveals whether your GPU is hitting memory limits that cause stuttering. The temperature reading helps identify cooling issues before they cause damage or thermal throttling.
For systems with multiple GPUs (gaming systems with discrete plus integrated GPUs, or workstations with multiple discrete cards), the application handles each GPU independently with separate metric displays. The configuration controls let you focus on whichever GPU is doing the work for your current activity, since showing all GPUs at once might produce more information than fits on screen comfortably.
Memory and disk activity
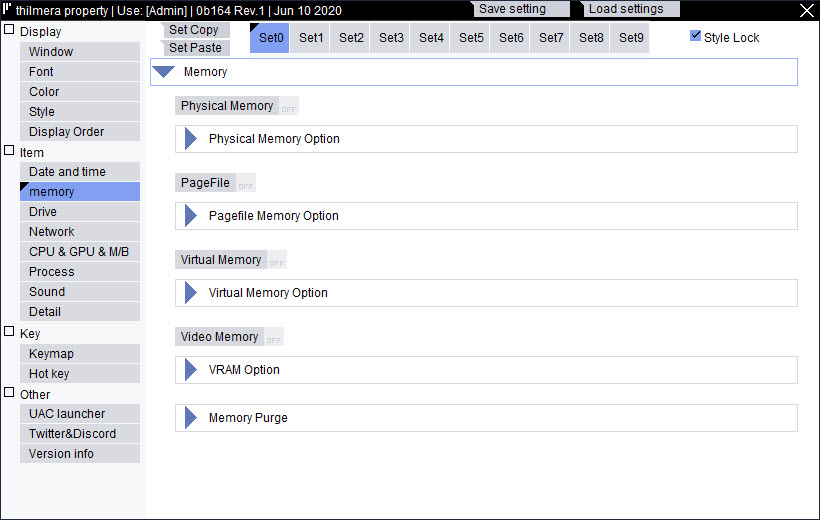
The memory monitoring shows total RAM, used RAM, available RAM, and (on configurations that support it) detailed breakdown by category including standby memory, modified memory, and free memory. The detailed breakdown matches what Resource Monitor exposes through the operating system but in a continuously visible format rather than requiring you to open a separate tool.
For users dealing with memory-intensive applications (large game worlds, video editing with high-resolution footage, scientific computing, virtual machines), the constant memory visibility helps identify when applications are approaching the limits of available RAM. Watching the trend rather than just point-in-time values reveals whether memory consumption is growing over time (potentially indicating memory leaks) or stable at normal operating levels.
The disk monitoring shows read and write activity in real time, with throughput measurements and queue depth indicators that reveal how busy each drive actually is. Multiple drives appear separately, which matters for systems with both fast SSDs and slower HDDs where the activity patterns differ substantially. For users wanting to find disk space usage trends or identify which folders are consuming space, dedicated disk space analyzers handle that complementary task while this software focuses on real-time activity rather than space allocation.
The activity monitoring helps identify what processes are reading or writing to disk during periods when you’re not actively using applications. Background services, automatic updates, antivirus scans, and various other activities that consume disk bandwidth become visible through the constant display rather than requiring you to specifically check.
Network throughput display
The network monitoring shows current upload and download speeds with running totals, plus connection-specific breakdown for systems with multiple network interfaces. Wi-Fi and Ethernet appear separately. VPN connections appear as additional interfaces. Various other virtual network adapters from different applications show up as distinct items.
For users wanting visibility into background network activity, this monitoring reveals when applications are consuming bandwidth without explicit user action. Cloud sync uploading files. Video streaming buffering. Updates downloading. Various other automatic activities that affect available bandwidth become visible. The visibility helps identify why your connection feels slow at specific times.
The current throughput reading versus your connection’s capacity helps assess whether you’re actually using the bandwidth you’re paying for. A 1 Gbps connection that’s only delivering 50 Mbps during downloads suggests something is limiting throughput. Watching the readings during deliberate testing helps isolate whether the limit is on your end, your network, or the source you’re downloading from.
Customization and panel configuration
The customization depth is what separates this software from simpler system monitors. Rather than fixed display layouts, the application uses a panel system where you configure what information appears, in what order, with what formatting. Build a layout focused on gaming with prominent CPU, GPU, RAM, and FPS-related metrics. Build a different layout for video editing with detailed disk activity, memory trends, and CPU per-core usage. Build a third layout for general use with weather, time, and basic resource overview.
Each panel handles one category of information with specific formatting controls. Choose which sub-metrics appear within each category. Adjust update frequencies separately for different metrics. Configure colors, fonts, and visual effects per panel. The granular control supports specific monitoring needs rather than forcing everyone into one default layout.
Multiple display configurations can be saved and switched between based on what you’re doing. Switch to the gaming configuration when launching games. Switch to the work configuration during normal use. Switch to a minimal configuration when you want monitoring without prominent visual presence. The configuration system supports this kind of context-based switching rather than requiring manual reconfiguration every time your needs change.
For users wanting to see specific workload patterns, the historical graph display shows trends across configurable time windows rather than only current values. Watch CPU usage across the last 30 seconds, 5 minutes, or hour.
Identify patterns of spikes and idle periods that might correlate with specific activities. The historical context produces understanding that point-in-time readings alone don’t deliver.
Sensors, weather, and unusual data displays
Beyond standard system metrics, the application includes various data displays that aren’t strictly system monitoring but that users find useful as supplementary information. Weather forecasts retrieve current conditions and forecasts from configurable sources, useful for users who want weather visible without opening separate weather applications.
Cryptocurrency price tickers track Bitcoin, Ethereum, and various other cryptocurrencies in real time. For users following crypto markets, this integration eliminates context switching to dedicated price tracking applications. The tickers update at configurable intervals and display in the same widget interface as system metrics.
Various sensor displays handle hardware monitoring beyond what the basic system metrics cover. Fan speeds for systems with sensor-accessible fans. Voltage readings for various components. Battery status with detailed power consumption metrics for laptops.
Hard drive SMART status indicating drive health beyond just usage and activity. The sensor coverage matches what dedicated hardware monitoring tools expose, with the difference being integration into a single unified widget rather than requiring separate applications.
For users wanting fan-specific monitoring and control rather than just observation, dedicated tools like SpeedFan provide more granular fan control than this application’s monitoring focus offers. The tools complement each other rather than replacing each other, with this software providing visibility while dedicated control utilities handle the specific control side.
Performance impact and resource usage
A monitoring tool that itself consumes substantial resources defeats its purpose. The application’s resource consumption stays modest because the developers prioritize efficient implementation over feature accumulation that doesn’t justify its cost. CPU usage from the monitoring itself typically stays under 1% on modern systems even with extensive metric displays. Memory consumption is similarly modest, with the entire application footprint being a few tens of megabytes regardless of how many metrics you’re tracking.
The lightweight implementation matters because monitoring is supposed to be transparent. Heavy monitoring tools that consume 5-10% CPU just to display metrics produce results contaminated by the monitoring overhead itself. This software’s efficiency keeps the readings clean by minimizing how much the monitoring affects what’s being monitored.
For users on older or constrained hardware where every CPU cycle and megabyte of RAM matters, the application remains usable without producing noticeable performance impact. The configuration options let you reduce update frequencies and disable specific monitoring categories for situations where minimum resource consumption is essential, with the trade-off being less responsive metric updates.
Considerations and limitations
The Japanese origins of the application produce some friction for English-speaking users. Documentation has been translated to English, but some of the more advanced configuration options have less polished translations than the core interface. The English support is functional rather than ideal, with some advanced features being easier to use after consulting community discussions or experimentation.
The customization depth that makes the application powerful also makes it overwhelming for users wanting plug-and-play simplicity. Default configurations are reasonable, but users who want to optimize the display for their specific needs face a substantial configuration learning curve. For users wanting simpler monitoring without the customization complexity, alternatives like the operating system’s built-in Task Manager or simpler system info tools like Speccy handle more limited needs without the complexity.
Some sensor support depends on motherboard implementation that varies by manufacturer. Specific temperature sensors, voltage readings, fan speeds, and various other hardware metrics may or may not work depending on whether your specific hardware exposes them through standard interfaces. The application generally handles common hardware well but may show “no data” for specific sensors on unusual configurations.
The weather and cryptocurrency features depend on external data sources that may change their APIs or terms over time. Updates to the application keep these integrations working in most cases, but users who depend specifically on these features should understand that their availability depends on third-party services beyond the application’s control.
The visual aesthetic, while functional, looks different from current desktop application design trends. The dense information presentation reflects priorities from when the application originally launched rather than current minimalist design preferences. For users who care about visual integration with modern desktop environments, the appearance may feel notably different from contemporary applications.
Conclusion
For users wanting comprehensive real-time system visibility through a configurable desktop widget rather than periodic Task Manager checks, thilmera7 delivers serious capability through its per-core CPU monitoring, detailed GPU metrics, granular memory breakdown, network and disk throughput display, and customization depth that supports specific monitoring use cases. More than two decades of continuous development produces a mature application with substantial accumulated capability and stability that newer monitoring tools haven’t matched.
The lightweight implementation keeps monitoring overhead minimal, which means the readings reflect actual system activity rather than being contaminated by heavy monitoring tools that affect what they’re trying to measure.
The reasons to consider alternatives are mostly about specific priorities. Users wanting hardware specifications and configuration details rather than real-time monitoring find Speccy covering that complementary use case more directly. Users specifically wanting fan speed control rather than just monitoring find dedicated tools like SpeedFan handling that control side better. Users wanting plug-and-play simplicity without configuration learning curves find the operating system’s built-in tools sufficient for basic awareness without the customization complexity.
But for users wanting comprehensive customizable monitoring that adapts to specific use cases through detailed configuration, this software remains one of the most capable options in the system monitoring category, with the long track record providing confidence that the tool works reliably across the variety of hardware configurations users actually have.
Pros & Cons
- Compact widget displays comprehensive system metrics through customizable layouts
- Per-core CPU monitoring reveals patterns that aggregated metrics hide
- GPU monitoring covers usage, VRAM, temperature, and frequency on supported hardware
- Memory monitoring includes detailed breakdown beyond simple used/free totals
- Disk and network throughput display in real time with per-device breakdown
- Customization through panel configuration supports specific monitoring use cases
- Multiple display configurations can be saved and switched between contexts
- Lightweight implementation produces minimal performance impact during monitoring
- Active development across more than two decades produces stable mature software
- Free without paid tiers gating core monitoring functionality
- Customization complexity overwhelms users wanting plug-and-play simplicity
- English documentation is functional but less polished than the Japanese original
- Sensor support varies based on motherboard manufacturer implementation
- Visual aesthetic reflects priorities from earlier application design eras
- Weather and cryptocurrency features depend on external services beyond the application's control
Frequently asked questions
This software is a system monitoring tool from Japanese developer Gakuto Matsumura that displays real-time hardware metrics through a customizable desktop widget. The display covers CPU usage per core with frequency and temperature, GPU usage with VRAM and temperature, RAM usage with detailed breakdown, disk and network throughput, and various other system metrics. The application also includes weather forecasts, cryptocurrency price tickers, and various sensor displays beyond standard system monitoring.
The application reads hardware metrics through standard sensor APIs that the operating system exposes, processes the readings into displayable values, and renders them through a configurable widget that sits on the desktop. The widget updates several times per second by default, with configurable update frequencies for different metric categories. The implementation prioritizes lightweight execution to minimize monitoring overhead affecting the metrics being monitored.
Install and launch the application, and the widget appears in its default position on your desktop showing default metrics. Right-click the widget to access configuration options, where you can choose which metrics to display, position the widget, adjust visual styling, and various other customization options. For users wanting specific layouts for specific use cases, the configuration system supports saving multiple configurations and switching between them based on context.
High CPU usage shown in the application is typically caused by other processes consuming CPU cycles rather than by the monitoring itself. The application uses minimal CPU (typically under 1% on modern systems), with whatever percentage is shown reflecting actual system activity. Per-core display helps identify whether a single core is at 100% (suggesting a single-threaded bottleneck) or whether load is distributed across cores (suggesting multi-threaded workload).
Yes, GPU temperature monitoring is included for graphics cards that expose temperature through standard interfaces. Most modern NVIDIA and AMD GPUs report temperature data that the application can read. Some integrated graphics or older GPUs may not expose temperature data through standard interfaces, with the application showing "no data" for those sensors. The temperature reading helps identify thermal issues before they cause damage or performance throttling.
Right-click the widget to access positioning options, or drag the widget directly with the mouse if drag mode is enabled in the configuration. The widget supports docking to screen edges, snapping to corners, or floating freely at any position you choose. For multi-monitor setups, the widget can be positioned on any monitor with full configuration of placement on each display.
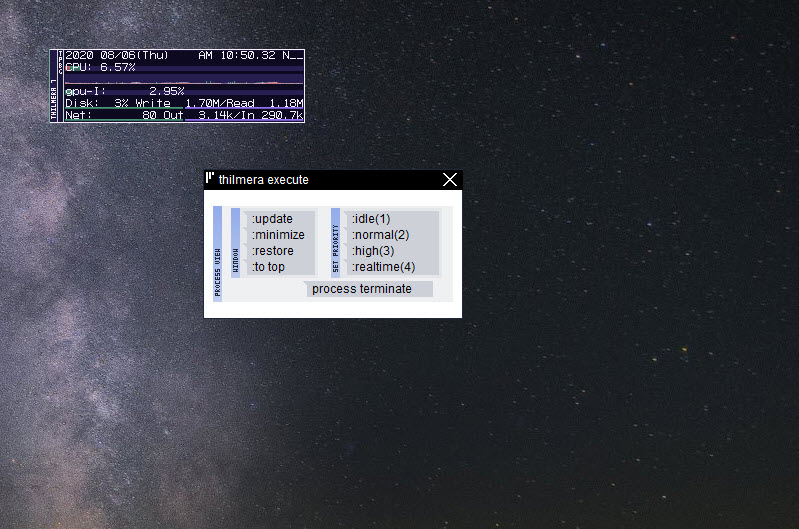
Task Manager (the built-in operating system tool) provides per-process detail and allows ending tasks or changing process priorities. thilmera7 provides continuously visible monitoring through a desktop widget without requiring you to open and check a separate tool. The two tools serve different purposes. Task Manager fits diagnostic situations where you need to investigate specific processes. This software fits ongoing visibility for resource patterns and trends. Many users run both, with Task Manager handling specific diagnostics while this software provides constant background awareness.
Speccy provides detailed system information snapshots covering hardware specifications, model numbers, and various other static data about your system configuration. thilmera7 focuses on real-time activity monitoring rather than configuration details. Speccy answers "what hardware do I have" while this software answers "what is my hardware doing right now." Users wanting both can run them complementarily, with each tool covering its specific use case better than alternatives that try to combine both.
Fan speed monitoring depends on motherboard sensors being accessible through standard interfaces. Some motherboards expose fan speeds through interfaces this application can read. Other motherboards use proprietary interfaces that require manufacturer-specific tools rather than general monitoring software. If fan speeds don't display, the issue is typically with hardware sensor accessibility rather than with the application itself. Users wanting fan monitoring on systems where this approach doesn't work may find motherboard-specific manufacturer utilities exposing the data this software can't access.
Yes, customization is one of the application's core strengths. The panel system lets you choose which metrics appear, in what order, with what formatting. Visual styling options control colors, fonts, transparency, and various other appearance elements. Multiple display configurations can be saved and switched between based on what you're doing. The customization depth supports specific monitoring needs rather than forcing one default layout on all users.