CPU-Z

 (47 votes, average: 4.57 out of 5)
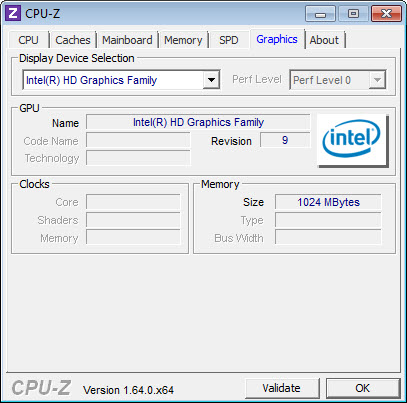
About CPU-Z
CPU-Z reads detailed information about your processor, motherboard, memory, and a few related components, presenting everything in a tabbed window organized by hardware category. The application is a fixture in the PC enthusiast and IT support world for the same reason it has been for years: it surfaces information the operating system either hides, presents incorrectly, or doesn’t expose at all.
When you need to know exactly which CPU stepping you have, what the actual memory timings are, what voltage your processor is running at right now, or whether your RAM is configured at its rated speed, CPU-Z is the tool that answers those questions in seconds.
The application’s scope is deliberately narrow. It identifies and monitors. It doesn’t benchmark in the way Cinebench does (though it has a built-in micro-benchmark for relative CPU comparison), it doesn’t stress-test hardware, and it doesn’t modify anything.
This focus on read-only diagnostics is part of why the tool has earned its position. It does one job well without trying to be a general-purpose system utility.
What each tab actually shows
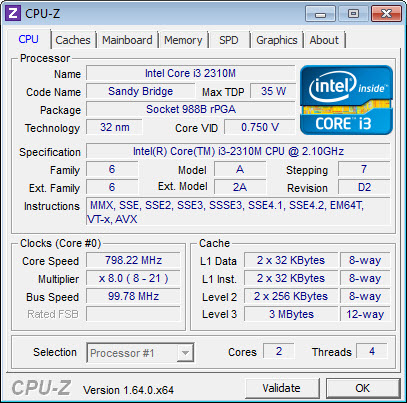
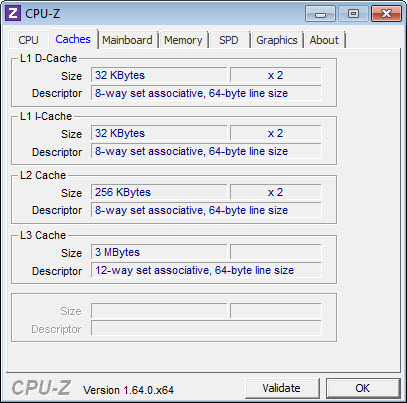
The first tab covers the CPU itself, and it’s the densest information panel in the application. The processor name, codename (the internal designation that often matters more than the marketing name), package type, technology process, and core/thread count. The current core voltage, the base clock, the multiplier, and the resulting clock speed. The complete instruction set support list (SSE variants, AVX support, virtualization extensions, security features). The L1, L2, and L3 cache sizes per core or shared, with associated way counts and line sizes.
This level of detail matters for several real workflows. Overclockers watch the live clock and voltage values to confirm their settings actually apply under load. Hardware buyers compare exact CPU steppings to identify which silicon revision they have (some steppings have known errata or different overclocking headroom). S
oftware developers checking instruction set availability use the precise feature flags rather than trusting the OS-reported summary. Support technicians identifying hardware in customer machines rely on the unambiguous reporting where Windows would show only the marketing name.
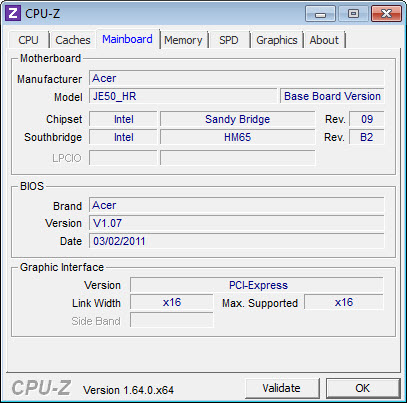
The Mainboard tab covers the motherboard model, manufacturer information, chipset, southbridge, BIOS version and date, and graphics interface details. The Memory tab shows the installed RAM type, total capacity, current channels (single, dual, or quad), current timings (CL, tRCD, tRP, tRAS, tRFC, and several others), and the running frequency.
The SPD tab digs deeper into the individual memory modules, showing each stick’s manufacturer, part number, serial number, JEDEC profiles, and XMP profiles if present.
The validation feature and what it does
The Validation tab is one of the more distinctive parts of the application and one of the most useful for users participating in overclocking communities. Generating a validation produces a cryptographically signed snapshot of the current system state, uploaded to a public validation database with a unique URL. Anyone with that URL can see exactly what hardware was detected at the moment of validation, with the data verified by the application’s signing key rather than user-editable text.
The use case is verification in benchmark competitions and overclocking communities. When someone claims a record CPU frequency, they post their validation URL as proof. The validation can’t be forged with a fake screenshot or a manipulated text export. The community-maintained database includes hundreds of thousands of validations from years of submissions, which makes it a useful reference for what specific CPU and motherboard combinations are capable of achieving.
For ordinary diagnostic use, validation also serves as a way to capture and share a complete system snapshot with someone trying to help diagnose a problem. Instead of describing the hardware verbally or sending multiple screenshots, sending a validation URL provides everything the diagnostician would need in one verified document.
The branded versions question
Several motherboard and graphics card manufacturers distribute customized versions of CPU-Z with their own branding (ROG, MSI Gaming, ASRock, Gigabyte). Functionally these are identical to the standard application, with the same hardware detection database and the same feature set. The difference is cosmetic. The interface gets reskinned with the manufacturer’s color scheme and logos, sometimes the validation submissions are tagged with the manufacturer’s identity, and occasionally the application is bundled with the manufacturer’s other tools.
For practical use, the branded versions and the standard version produce the same results. Users who installed a branded version through their motherboard’s bundled software, then later wondered if they were missing something by not having the official version, aren’t missing anything.
Users who specifically want the unbranded reference version can install it without conflict, even on systems where a branded version is already present.
Real-time monitoring versus snapshot reading
The application updates its readings continuously while running, which means the CPU frequency, voltage, and multiplier displays reflect what’s happening right now rather than a static snapshot. Watching the CPU clock under load is one of the most common practical uses.
If your processor is rated for 4.5 GHz boost and you’re seeing it stuck at 3.8 GHz during heavy workloads, something is limiting it (thermal throttling, power limits, undervolting, BIOS configuration), and the tool surfaces that immediately.
The monitoring is more limited than what dedicated tools like Core Temp or HWiNFO provide. The application doesn’t show temperatures (a notable absence given how many users assume it does), doesn’t graph values over time, and doesn’t alert on threshold conditions. For pure monitoring workflows, dedicated monitoring software is the better choice. CPU-Z is for inspecting and identifying, with live updates as a useful side effect rather than the main purpose.
For pairing with GPU information, GPU-Z covers the graphics side with the same diagnostic philosophy. The two applications together provide a comprehensive read on PC hardware that maps directly onto the most common questions users have about their own systems.
Portable mode and deployment scenarios
The portable version runs without installation, which makes it the standard tool on IT technician USB sticks. Plug in the drive, run the executable, identify the hardware, close it. Nothing gets written to the Windows registry, no services get installed, no startup entries get created. For diagnosing customer machines where you don’t want to leave traces of your visit, this is the right deployment.
The portable version also runs on systems where installation isn’t possible (limited user accounts, locked-down corporate machines, recovery environments). The single executable carries everything it needs, including the hardware identification database.
Conclusion
CPU-Z is the right tool for anyone who needs accurate, detailed information about PC hardware. The target audience covers IT support technicians identifying customer hardware, overclockers monitoring live CPU behavior, hardware enthusiasts verifying their builds match what they paid for, software developers checking precise instruction set availability, and users diagnosing performance issues by confirming what their hardware is actually doing under load.
It’s the wrong choice for users who specifically need temperature monitoring, threshold alerts, or historical graphs (where dedicated monitoring tools cover that ground), for users who want benchmarking as a primary function rather than identification, or for casual users whose only question is “what CPU do I have?” (where simpler tools like Speccy present the same basic information in a less technical format).
For the specific job of seeing exactly what’s inside a PC and what it’s doing right now, the application remains the reference tool, and the depth of information it surfaces continues to justify its position despite being deliberately narrow in scope.
Pros & Cons
- Detailed CPU identification including codename, stepping, exact clock speeds, voltages, and complete instruction set support
- Memory tab and SPD detail expose actual configured timings rather than just rated speeds
- Validation feature produces verified snapshots that overclocking communities use as proof of records
- Real-time updates show current clock and voltage values, useful for diagnosing throttling
- Portable version requires no installation and leaves no traces on the host system
- Free with no subscriptions, license restrictions, or feature lockouts
- No temperature readings despite being commonly assumed to provide them
- Monitoring is limited to current values, with no historical graphs or threshold alerts
- Built-in benchmark is useful for relative comparison but isn't a full benchmarking suite
- Information density can overwhelm users who only need basic hardware identification
- Mainboard tab occasionally shows incomplete information on newer or unusual motherboard models
- Hardware database updates require new application versions to support the latest CPUs and chipsets
Frequently asked questions
The application reads detailed information about the processor, motherboard, memory modules, and basic graphics information, presenting everything in a tabbed window. It also includes a built-in CPU micro-benchmark for relative comparison and a validation feature for verified hardware snapshots.
No. Despite the common assumption, the application doesn't display temperature readings. For temperature monitoring, dedicated tools like Core Temp or HWiNFO cover that gap.
The branded versions are functionally identical to the standard application. The differences are cosmetic (interface skin, manufacturer branding) and sometimes packaging-related. The hardware detection and feature set are the same.
The capabilities are the same. The portable version runs without installation and leaves no traces on the host system, which makes it the standard tool for IT support work on customer machines.
Validation produces a cryptographically signed snapshot of the current system, uploaded to a public database with a unique URL. The signing prevents tampering, which is why overclocking communities use validations as proof of records.
The two applications cover different hardware. GPU-Z does for graphics cards what CPU-Z does for processors, memory, and motherboards. Most users who run one also run the other for complete hardware coverage.
Modern processors throttle their clock speeds based on workload, temperature, and power limits. The application shows the current actual frequency, which is often below the rated boost when the CPU isn't under heavy sustained load. Running a CPU-intensive workload and watching the frequency rise is the easiest way to confirm boost behavior is working.