Memory Cleaner

 (96 votes, average: 4.01 out of 5)
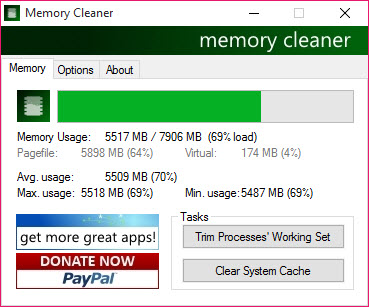
About Memory Cleaner
Memory Cleaner does two specific things to your system memory. It trims the working set of running processes, asking the operating system to release memory that processes are holding but not actively using, and it clears the system cache, dropping cached file system data that the OS is keeping in RAM for performance reasons.
Both operations run on demand or automatically when your RAM usage crosses a threshold you configure (the default is 80%, with the option to also run every 5 minutes regardless of usage). The application sits quietly in the system tray and shows a brief notification with the amount of RAM recovered after each cleanup, with no popup windows interrupting whatever you’re doing.
The application also continuously monitors RAM consumption and reports minimum, maximum, and average usage across your session, with the average calculated as a true running average rather than the (min+max)/2 shortcut that some monitoring tools mislabel as average. The whole package weighs in at well under a megabyte, runs without drama, and stays out of the way until either the threshold triggers or you manually click the Clear button.
For users running into actual RAM pressure on systems with limited memory (older machines, virtual machines with constrained allocations, configurations where memory is genuinely scarce), the trim and cache clear operations recover real RAM that lets demanding applications continue running. For users with plenty of RAM, the tool becomes more of a curiosity than a necessity, which is honest context worth establishing before going deeper.
How working set trimming actually works
The working set of a process is the portion of its allocated memory currently mapped into physical RAM, as opposed to memory that’s been paged out to the swap file or that the process has reserved but not actively used. Operating systems automatically manage working sets, expanding them when processes need more active memory and contracting them under memory pressure. The trim operation Memory Cleaner performs is a request to the OS asking it to immediately reduce process working sets to their minimum, freeing the difference back to the available pool.
The practical effect is real but bounded. Processes that were genuinely using all their working set memory get that memory back when they next access it, with the access triggering page faults that pull data back from the swap file. This is invisible to the user but does add latency. Processes that were holding memory they didn’t actually need release it permanently with no performance cost. The net result depends on which side of that ratio your specific applications fall on.
For applications with known memory bloat issues (long-running browsers that have accumulated memory across hundreds of tabs and reloads, IDEs that have grown their working set across days of operation, any application that doesn’t manage its own memory aggressively), the trim operation often releases hundreds of megabytes that the process couldn’t reach on its own. For lean applications that already manage memory well, the same operation releases very little because there’s nothing extra to release.
Clearing the system cache
The system cache is RAM the operating system uses to hold recently-accessed file system data, allowing repeated reads of the same files to come from memory rather than disk. The cache exists for good reasons: most programs read the same files many times during normal operation, and cached reads are dramatically faster than disk reads even on modern SSDs. Under memory pressure, the OS automatically releases cache to make room for application memory, which means the cache is normally self-managing.
The Clear System Cache operation drops the cached data immediately rather than waiting for memory pressure to trigger automatic eviction. This recovers the RAM occupied by the cache, but at the cost of forcing applications to re-read files from disk on their next access.
Whether this trade-off makes sense depends on your specific workload. For users about to launch a memory-intensive application that needs all available RAM right now, dropping the cache provides that RAM immediately. For users with normal background workloads, dropping the cache produces transient slowness as files get re-cached without much practical benefit.
The application makes both operations visible and lets you trigger them independently, which is more transparent than tools that lump everything into a single “optimize” button. If you only want to trim working sets without dropping the file cache (the more common useful case), you can do exactly that.
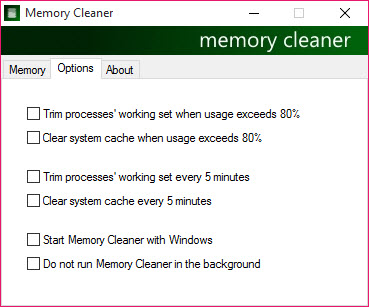
Auto-trim threshold and scheduling
The automation features are where this tool differentiates from manual-only memory utilities. The Options tab includes two key automation triggers: percentage-based (run cleanup when RAM usage exceeds a configurable threshold, with 80% as the default) and time-based (run cleanup every N minutes regardless of usage, with 5 minutes as the default for users who enable it).
The threshold-based automation is the more useful of the two for most users. Set the threshold to 85% or 90%, and the cleanup only runs when memory pressure actually exists. Below the threshold, the tool stays quiet and does nothing.
This matches the actual use case for memory cleaners: the times when freeing RAM matters are exactly the times when usage is high. Running cleanup at low memory levels achieves nothing useful, since unused RAM that gets “freed” was already available.
The time-based automation is more questionable in practice. Running cleanup every 5 minutes regardless of need produces real overhead (the trim operation itself takes CPU cycles, and forcing applications to re-page their working sets has performance costs) for theoretical benefit (recovering RAM you might not actually need). For most users, leaving this option disabled and relying on threshold-based triggering produces better results.
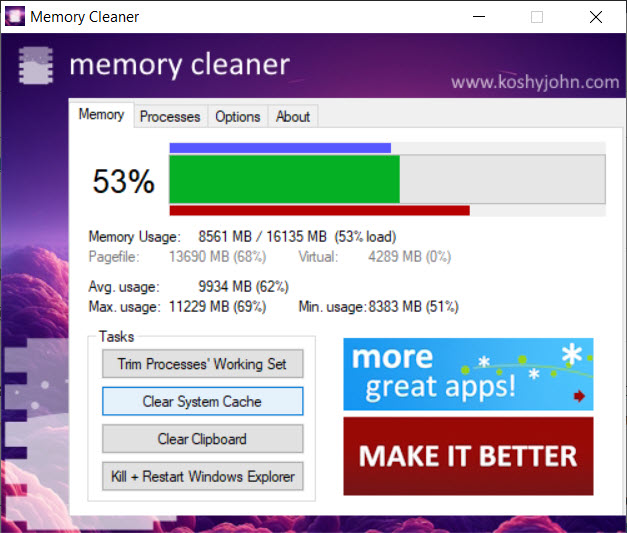
Real-time monitoring with proper averages
The monitoring panel shows current RAM usage, peak usage during the session, minimum usage during the session, and average usage. The average specifically matters because it’s calculated as a true running average over time rather than the (min+max)/2 shortcut that some monitoring tools use and mislabel as average.
The mathematical distinction is real: a system that spent 95% of its time at 60% RAM usage but briefly spiked to 90% has very different characteristics from a system that spent half its time at 60% and half at 90%, even though the (min+max)/2 calculation would produce the same number for both.
For users diagnosing memory issues, the proper average tells you whether high peak usage is sustained or transient. If your peak hit 90% but your average is 50%, the spike was probably brief and didn’t cause sustained problems. If your peak hit 90% and your average is 80%, you’re spending substantial time near the upper limit, with corresponding implications for system responsiveness and swap file usage.
The monitoring runs continuously while the application is open, which means a session of several hours produces more reliable averages than a session of a few minutes. For users who want to characterize their typical RAM usage patterns, leaving the application running in the background for a representative work session produces useful data.
Silent operation and the brief notification
The interaction model is built around staying out of the way. The application sits in the system tray with no main window taking up screen space. When cleanup runs (manually triggered or automatically through threshold or schedule), the only feedback is a brief notification showing how much RAM was recovered. No popup dialogs, no progress bars, no confirmation prompts.
For users who want their utility software invisible until needed, this design works well. Memory cleanup happens, the notification flashes, work continues without interruption. Compared to applications that take over the screen with optimization animations and detailed reports, the unobtrusive approach respects the user’s attention.
The trade-off is that users who want detailed feedback about exactly what was cleaned or which processes had their working sets trimmed don’t get that information by default. The data exists in the running session, but the notification stops at “X MB recovered” rather than breaking down the source. For most use cases this is fine; for users specifically debugging memory behavior of specific processes, dedicated process explorer tools serve that need better.
When memory cleaners actually help (and when they don’t)
The honest framing this tool deserves: memory cleaners are useful in a narrower set of scenarios than their marketing typically suggests. The argument against running them is real and worth understanding. Modern operating systems already manage memory automatically. Unused RAM serves as cache that improves performance. “Free” RAM at the bottom of the gauge isn’t actually wasted, and the OS will release cache when applications need memory.
Where memory cleaners genuinely help: systems running short on RAM (older machines with 4 to 8 GB, virtual machines with constrained allocations, configurations where memory pressure is real and constant), applications with known memory leak or bloat issues that don’t manage their working sets well on their own, situations where you’re about to launch something memory-intensive and want to recover whatever you can beforehand. In these cases, the trim and cache clear operations recover real RAM with practical benefit.
Where memory cleaners are mostly theater: modern systems with 16, 32, or 64 GB of RAM where memory pressure rarely exists, well-behaved applications that manage their own memory effectively, idle systems where the OS would release memory automatically when needed. In these cases, running cleanup periodically just adds overhead without producing meaningful benefits, and the “freed” RAM the tool reports was effectively available anyway.
Setting the auto-trim threshold higher rather than lower (90% rather than 50%) matches this reality. Cleanup runs when it actually matters; idle time is left alone.
Comparison with the alternatives
Among the dozens of memory cleaner utilities available, the meaningful comparisons fall into a few categories. Wise Memory Optimizer occupies similar territory with a slightly more polished interface and similar feature set. Memory Cleaner is more lightweight; Wise has marginally better visual design. The functional output is essentially equivalent.
Empty Standby List and similar single-purpose tools focus narrowly on emptying the standby cache (memory holding files that have been paged out but not yet released to free) and don’t include the trim and monitoring features this tool combines. For users who want only the standby clearing, those tools are simpler. For users who want the full feature set, this software covers more ground.
Built-in alternatives include the Performance Monitor for tracking RAM usage and Task Manager’s process explorer for spot-checking which processes are using how much memory. These tools don’t include the automated cleanup functionality, but they’re free and pre-installed. For diagnostic purposes alone, the built-in tools are often sufficient. For active cleanup automation, dedicated tools like this one fill the gap.
Avast Cleanup, CCleaner, and similar all-in-one optimization suites include memory cleaning as one feature among many. The depth of memory-specific features in those suites is generally less than dedicated tools, with the trade-off being a single application that handles disk cleanup, registry cleanup, and other tasks alongside memory management. For users wanting one tool for everything, the suites work; for users wanting the right tool for memory specifically, dedicated tools like this software produce better results.
Considerations and limitations
The actual benefit varies dramatically based on system configuration. Users with abundant RAM (32 GB or more on modern hardware) typically see minimal practical improvement from running this software, since memory pressure rarely exists and the OS already manages cache effectively. The tool runs and reports recovered megabytes, but those megabytes weren’t constraining anything in the first place.
Aggressive cleanup can produce transient performance issues. Trimming working sets forces processes to re-page memory they need next, with the page faults adding latency. Clearing the cache forces files to be re-read from disk. Neither operation is harmful, but back-to-back cleanups during active work produce visible micro-stutters that don’t happen if you let the OS manage memory itself.
The application doesn’t differentiate between processes that need their working sets and processes that don’t. The trim operation applies uniformly across all running processes, which means well-behaved applications get treated the same as memory hogs. For users who want surgical control (trim Chrome but leave the IDE alone, for example), this tool doesn’t provide that granularity.
Some users find the threshold-based automation insufficient and want more granular triggers (run when specific applications launch, run after closing memory-intensive tasks, run during specific time windows). The current automation handles the simple cases well but doesn’t extend to the more sophisticated triggers that power users sometimes want.
The development pace has been moderate rather than aggressive across recent years, with updates appearing periodically rather than continuously. The application is mature and stable, but users wanting cutting-edge features as they emerge in the broader memory management space may find the development cadence slower than alternatives with larger development teams.
Conclusion
For users who genuinely need RAM management on memory-constrained systems, Memory Cleaner delivers what its name promises through a focused feature set: working set trimming, cache clearing, configurable automation, and proper monitoring with mathematically correct averages. The lightweight design, silent operation, and threshold-based triggering produce a tool that stays out of the way until it actually matters, which fits the practical use case better than aggressive optimization suites that interrupt your work to advertise their effectiveness.
The reasonable considerations are mostly about whether you need a memory cleaner at all. Modern systems with abundant RAM and well-behaved applications mostly don’t. Older systems, memory-constrained configurations, or workflows involving applications with known memory issues often do.
Users in the first category can skip this tool with minimal practical impact. Users in the second category find the trim and cache clear operations genuinely useful, with the threshold-based automation producing real benefit at the moments when memory pressure actually exists.
Setting expectations honestly (cleanup helps when memory matters; cleanup is overhead when it doesn’t) matches what the tool actually does rather than what marketing for memory cleaners typically promises.
Features & benefits
Pros & Cons
- Trims process working sets and clears system cache through clearly separated operations
- Auto-trim threshold automation runs cleanup only when RAM usage exceeds a configurable percentage
- Real-time monitoring with proper running averages instead of (min+max)/2 shortcuts
- Silent system tray operation with brief notifications rather than intrusive dialogs
- Lightweight footprint suitable for systems where every megabyte matters
- Configurable scheduling adds time-based triggers alongside threshold-based ones
- Manual cleanup triggered by single button click for on-demand recovery
- Benefit is marginal for systems with abundant RAM and well-behaved applications
- Aggressive automation can produce transient performance issues from re-paging
- No granular control over which specific processes get their working sets trimmed
- Time-based scheduling option is more harmful than helpful for most users
- Less polished visual design than commercial memory utilities
- Development cadence is moderate rather than aggressive
Frequently asked questions
This software is a lightweight Windows utility that frees up RAM by trimming the working sets of running processes and clearing the system cache. It includes real-time RAM monitoring with proper running averages, auto-trim functionality triggered by configurable usage thresholds, and a silent system tray operation that shows brief notifications when cleanup completes.
Run the application and let it sit in the system tray. The main window shows current RAM usage and the Trim Processes' Working Set and Clear System Cache buttons for manual cleanup. The Options tab configures auto-trim thresholds (default 80%) and time-based scheduling. For typical use, set the threshold higher (around 85% to 90%) so cleanup runs only when memory pressure actually exists.
The Trim operation asks the operating system to reduce each process's working set (the portion of allocated memory currently mapped into RAM) to its minimum. Memory that processes were holding but not actively using gets released back to the available pool. The Clear System Cache operation drops cached file system data that the OS keeps in RAM for performance, recovering that RAM at the cost of forcing files to be re-read from disk on next access.
The honest answer depends on your system. For machines with limited RAM (older systems, configurations under 8 GB), VMs with constrained allocations, or applications with known memory bloat, the cleanup operations recover real RAM that lets demanding applications continue running. For systems with abundant RAM (16 GB+) and well-behaved applications, the operating system already manages memory automatically, and dedicated cleaners produce minimal practical improvement.
Open the Options tab and enable the auto-trim feature. Set the threshold percentage (default 80%, but 85% to 90% works better in practice since it triggers cleanup only when memory pressure is real). Optionally enable the time-based scheduling, though this is generally less useful than threshold-based triggering and adds overhead without proportional benefit.
The trim operation reduces process working sets to their minimum, freeing memory that processes have allocated but aren't actively accessing. This is invisible to applications that need the memory back (they trigger page faults to reload data from the swap file when needed) and produces real recovered RAM for applications that were holding memory unnecessarily. The benefit varies by application: bloated processes release substantial memory; lean processes release little.
The application calculates RAM usage average as a true running average over time, sampling current usage at regular intervals and averaging the samples. This differs from tools that calculate average as (min+max)/2, which is mathematically misleading because it ignores how much time was spent at different usage levels. The proper running average tells you whether your typical usage was near the maximum or near the minimum, which matters for understanding system behavior.
Wise Memory Optimizer occupies similar territory with comparable features: working set trimming, cache clearing, automation through thresholds. The visual design is slightly more polished, and the development team is larger, with marginally more frequent updates. Memory Cleaner is more lightweight (smaller installation, lower resource usage) with essentially equivalent functional output. Either works; the choice often comes down to interface preference rather than capability difference.
A restart clears all RAM and starts every application fresh, which produces a more thorough memory reset than this tool can achieve. The trade-off is that restarting closes everything you were working on, while this software runs without disrupting active applications. For situations where restarting is impractical (long-running tasks, complex multi-application workflows you don't want to rebuild), the tool provides a way to recover memory without the disruption.