RAMMap

 (4 votes, average: 3.00 out of 5)
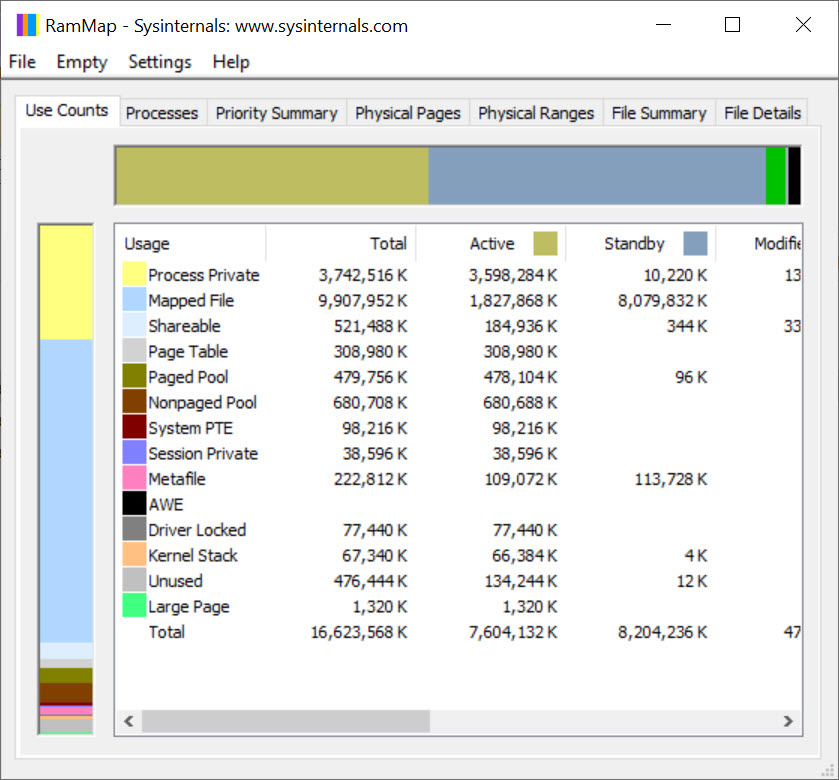
About RAMMap
Most users have, at one point or another, opened Task Manager wondering why their computer feels sluggish despite having plenty of RAM installed. The numbers don’t quite add up. Memory usage looks reasonable on the surface, but somehow the system still drags its feet, and there’s no obvious culprit hogging resources. RAMMap is the small, free utility from Microsoft’s Sysinternals suite that lets you actually see what’s going on inside your physical memory, beyond what Task Manager will ever tell you.
Originally developed by Mark Russinovich and Bryce Cogswell, this tool has become something of a quiet legend among system administrators, IT professionals, and tinkerers who want to understand exactly how Windows manages memory.
It does not pretend to be a memory cleaner in the way that dozens of dubious utilities advertise themselves. Instead, it gives you a deep, technical view of memory allocation across various categories, processes, and physical pages, which is a different and far more useful proposition.
A different way of looking at RAM usage
Where Task Manager shows simplified categories like “In use”, “Available” and “Cached” RAMMap breaks memory down into a much richer set of categories such as Active, Standby, Modified, Modified No Write, Transition, Zeroed, Free, and Bad. For users who don’t know the difference between these states, the answer is that Windows manages memory in far more sophisticated ways than the simplified Task Manager view suggests, and understanding the breakdown can solve real problems.
The Use Counts tab summarizes how memory is distributed across each of these states, while other tabs let you see specifically which processes are using how much, which files are mapped into memory, and which physical pages are allocated to what.
For diagnosing memory leaks, identifying applications that hold on to memory longer than expected, or simply satisfying technical curiosity, this level of detail is genuinely valuable.
The famous Empty Standby List feature
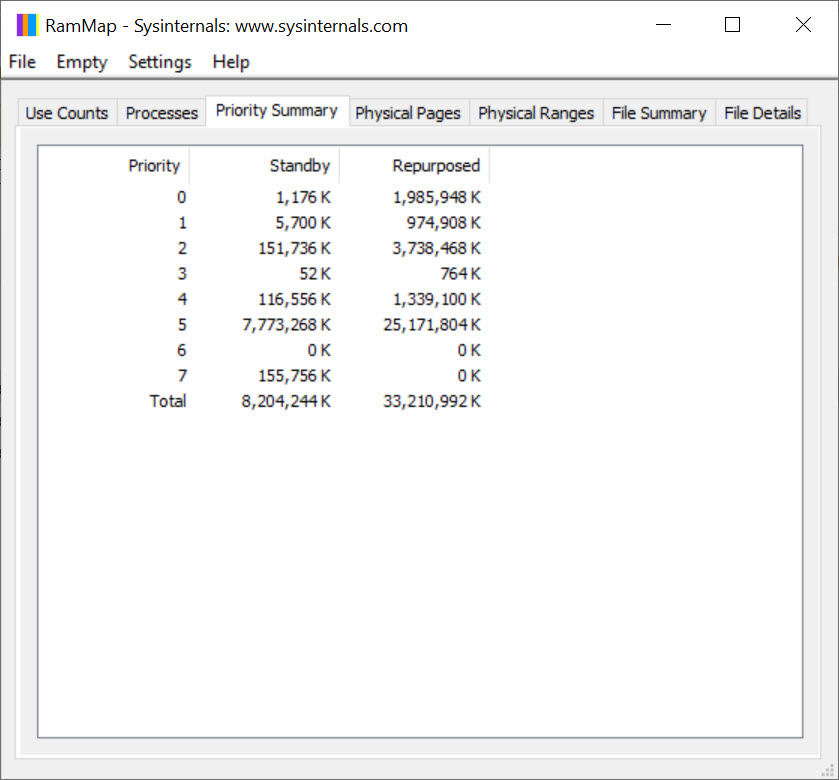
One of the most popular reasons users seek out RAMMap is the Empty options under the Empty menu. The Empty Standby List option in particular has become a go-to trick for users dealing with applications, particularly games or video editing software, that gradually fill up the standby memory and seem to slow the system over time.
The standby list is essentially a cache of recently used data that Windows keeps around in case it’s needed again. Most of the time, this is a good thing, since it speeds up access to recently closed applications. But on systems running heavy workloads, the standby list can grow to the point where it interferes with other processes that need fresh memory. Manually emptying it can sometimes restore responsiveness without requiring a full system reboot.
This is not a magic fix, and overusing it would defeat the purpose of having a cache in the first place. But for specific scenarios where you’ve noticed performance dropping after long sessions of certain applications, it’s a tool worth knowing about.
Detailed process and file mappings
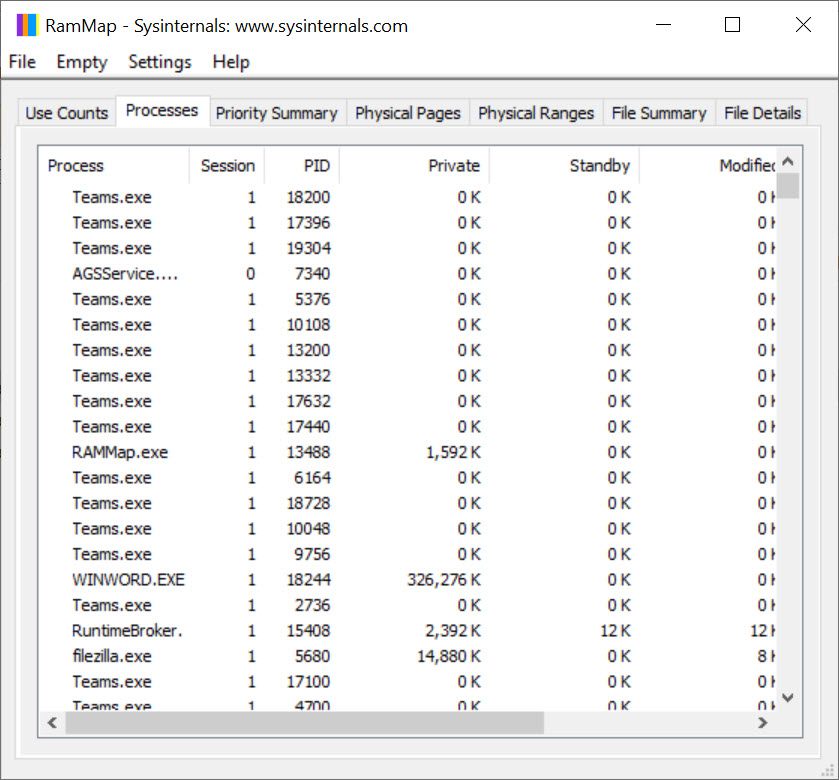
The Processes tab shows you a clean breakdown of how each running process is using physical memory, which is useful when you suspect a specific application is the source of a slowdown. The numbers go beyond what Task Manager provides, including details on private memory, shareable memory, shared memory, and locked memory, each of which behaves differently in terms of how Windows manages it.
The File Summary and File Details tabs are even more interesting for power users. They show which files are currently mapped into memory, including DLLs, executables, and various system components. For developers and IT professionals investigating performance issues, this view can reveal unexpected memory usage that no other tool exposes as clearly.
Saving snapshots for comparison
A particularly useful feature is the ability to save snapshots of the current memory state to a file, which can then be loaded later for comparison. This is invaluable for troubleshooting scenarios where you want to capture the state before and after a specific event, like running a memory-intensive application or applying a system change, to see exactly what changed.
For consultants or support technicians dealing with memory-related complaints, this capability allows for proper before-and-after analysis rather than relying on user descriptions of vague slowdowns.
Physical memory page-level analysis
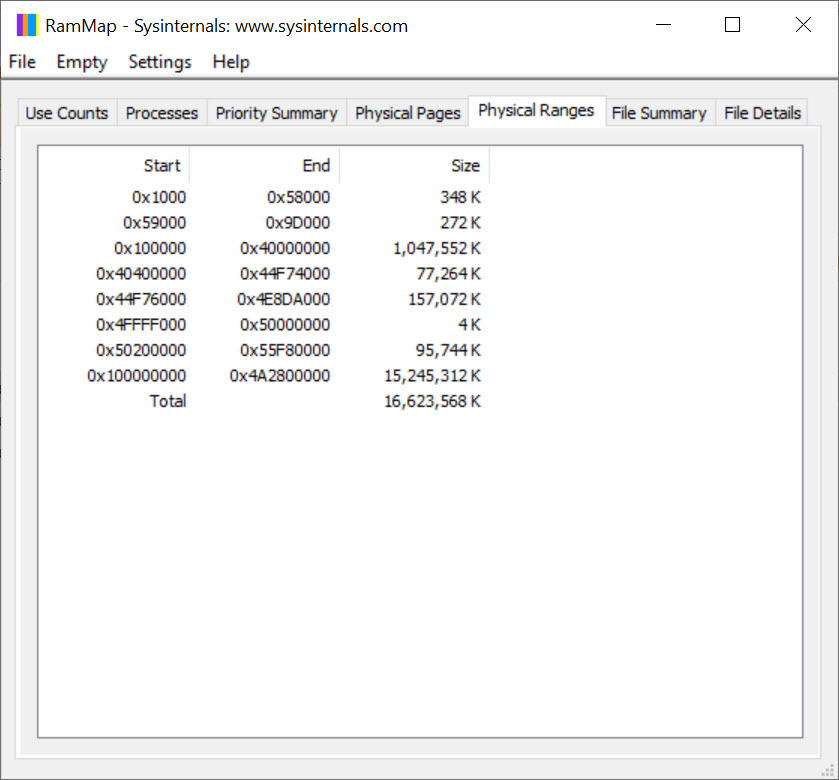
For the truly technical user, the Physical Pages and Physical Ranges tabs provide page-level details about every individual block of physical memory in the system. You can see which physical pages are in use, what they’re being used for, and whether any pages have been marked as bad due to hardware errors.
This level of detail goes far beyond what most users will ever need, but for hardware troubleshooting, kernel debugging, or simply understanding how Windows actually manages memory at the lowest level, there’s nothing else quite like it in the standard Windows toolbox.
When to use it (and when not to)
Despite its capabilities, RAMMap is not for everyone. Users who simply want their computer to “feel faster” will be disappointed by the lack of a single magic button that does the optimization for them. The tool is built for understanding and analysis, not automated cleanup. The Empty Standby List feature is the closest thing to a quick fix, but even that should be used judiciously rather than as a routine maintenance step.
For developers debugging memory issues, system administrators investigating server slowdowns, gamers troubleshooting standby memory bloat, or curious users who want to know what their RAM is actually doing, this software is genuinely useful. For everyone else, the simpler Task Manager and Resource Monitor probably cover what they need.
Conclusion
RAMMap is one of those tools that quietly demonstrates how much complexity Windows hides from typical users. For most people, the simplified Task Manager view is enough, and that’s fine. But for users who actually want to understand what their RAM is doing, who need to diagnose tricky memory issues, or who like having a serious analysis tool available when problems arise, this software is essentially without competition.
It’s technical, it’s opinionated about its purpose, and it doesn’t hold your hand. But for the audience it’s built for, RAMMap delivers exactly what it promises, which is a clear and detailed view of memory that no other standard tool provides.
Pros & Cons
- Detailed breakdown of memory usage by state, process, and file far beyond Task Manager
- Empty Standby List feature can recover memory consumed by aggressive caching
- Process-level view shows memory allocation in unprecedented detail
- File mapping view reveals which files are currently held in physical memory
- Snapshot save and load enables proper before-and-after analysis
- Physical page-level details support hardware diagnostics and kernel work
- Portable executable runs without installation and uses minimal resources
- Updated to support modern Windows versions including Windows 11
- Interface is dense and assumes technical familiarity with Windows memory concepts
- No automated optimization or cleanup beyond manual Empty operations
- Visual design feels utilitarian compared to modern monitoring tools
- Limited usefulness for users who just want their PC to feel faster
- Documentation is sparse, leaving newcomers to learn through experimentation
Frequently asked questions
This software shows physical memory usage broken down by states like Active, Standby, Modified, and Free, along with details about which processes and files are using which pages. Task Manager only shows simplified categories, while this tool reveals the full picture, which is essential for diagnosing memory issues that simpler views miss.
Not directly. This software is an analysis and diagnostic tool, not an automatic optimizer. The Empty Standby List feature can occasionally restore performance after specific workloads have filled up the cache, but the main value of the tool lies in helping you understand and identify memory issues rather than fixing them automatically.
Yes, the Empty options use legitimate Windows API calls and don't cause damage to the system. However, emptying the standby list too frequently defeats the purpose of caching, so it should be used selectively rather than as routine maintenance. Other Empty options like Empty Working Sets are generally safe but rarely necessary outside specific troubleshooting scenarios.
This software is part of the Sysinternals suite, originally created by Mark Russinovich and Bryce Cogswell before Microsoft acquired the suite in 2006. Today the tools are maintained as part of Microsoft's official offerings, although they retain the technical depth and lean design that made them famous in the first place.
This tool is excellent for identifying memory leaks because it shows exactly which processes and which types of memory are growing over time. By taking snapshots before and after running an application, you can see precisely where memory is being allocated and identify processes that don't release memory properly when they should.
Standby memory contains data that Windows is keeping cached in case it's needed again, even though no process currently has it actively in use. This caching speeds up access to recently used files and applications, but it can occasionally grow to the point where it competes with active processes for available RAM, which is when the Empty Standby List feature becomes useful.
Most third-party RAM cleaner utilities are essentially placebo software that achieves little or nothing useful, sometimes by aggressively forcing applications to release memory in ways that hurt performance. This tool is different because it shows you what's actually happening rather than promising automatic optimization, and the cleanup options it does offer use proper Windows APIs rather than dubious tricks.