

Process Monitor
About Process Monitor
Process Monitor records everything every program on the machine does to files, the registry and the network, as it happens, and lets you filter the flood down to the one line that explains a problem.
A program that will not start because a configuration file is missing. A setting that reverts every morning because something writes it back. A folder that fills with temporary files nobody can trace. A licence check that fails because it looks in the wrong place. Each of these produces a line in the capture that says exactly which process touched exactly which path with exactly what result, and finding that line is what this tool is for.
It belongs to the same family as Process Explorer and Autoruns, and the division of labour is clear. Process Explorer shows what is running now. Process Monitor shows what it did, at the level of individual operations, thousands per second.
Nothing else on a desktop gives that view without a debugger. That is why support engineers and malware analysts reach for it first when a machine is misbehaving in a way nobody can explain.
What gets captured
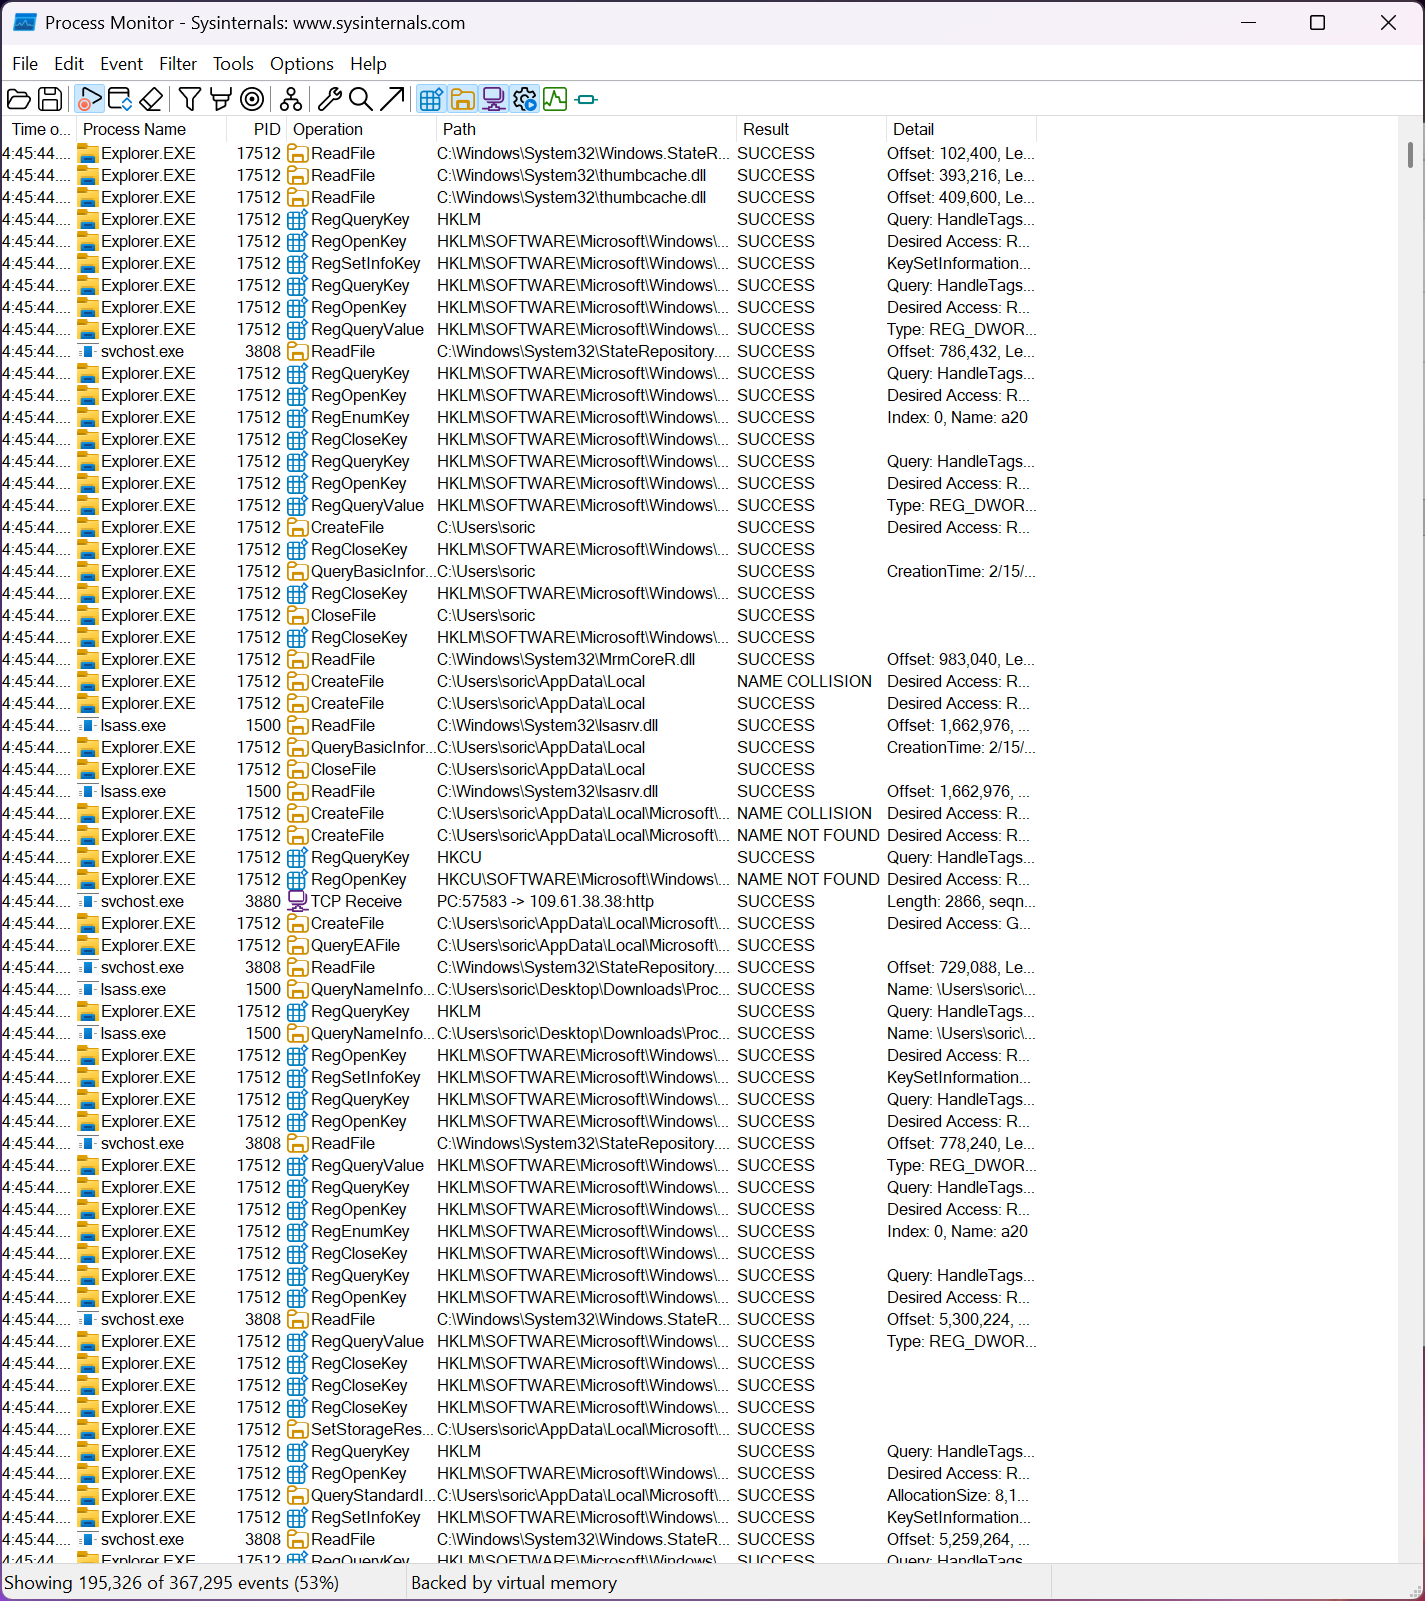
Five classes of event stream in. File system operations, every open and read and write with the path and the result. Registry operations, every key opened and every value read or written. Process and thread activity, including starts, exits and image loads. Network activity, meaning connections and transfers with the endpoints. And profiling events, a periodic snapshot of each thread’s stack for finding where time goes. Each class has a toolbar button that turns it on or off, and turning off network and profiling is the first thing most people do to cut the volume.
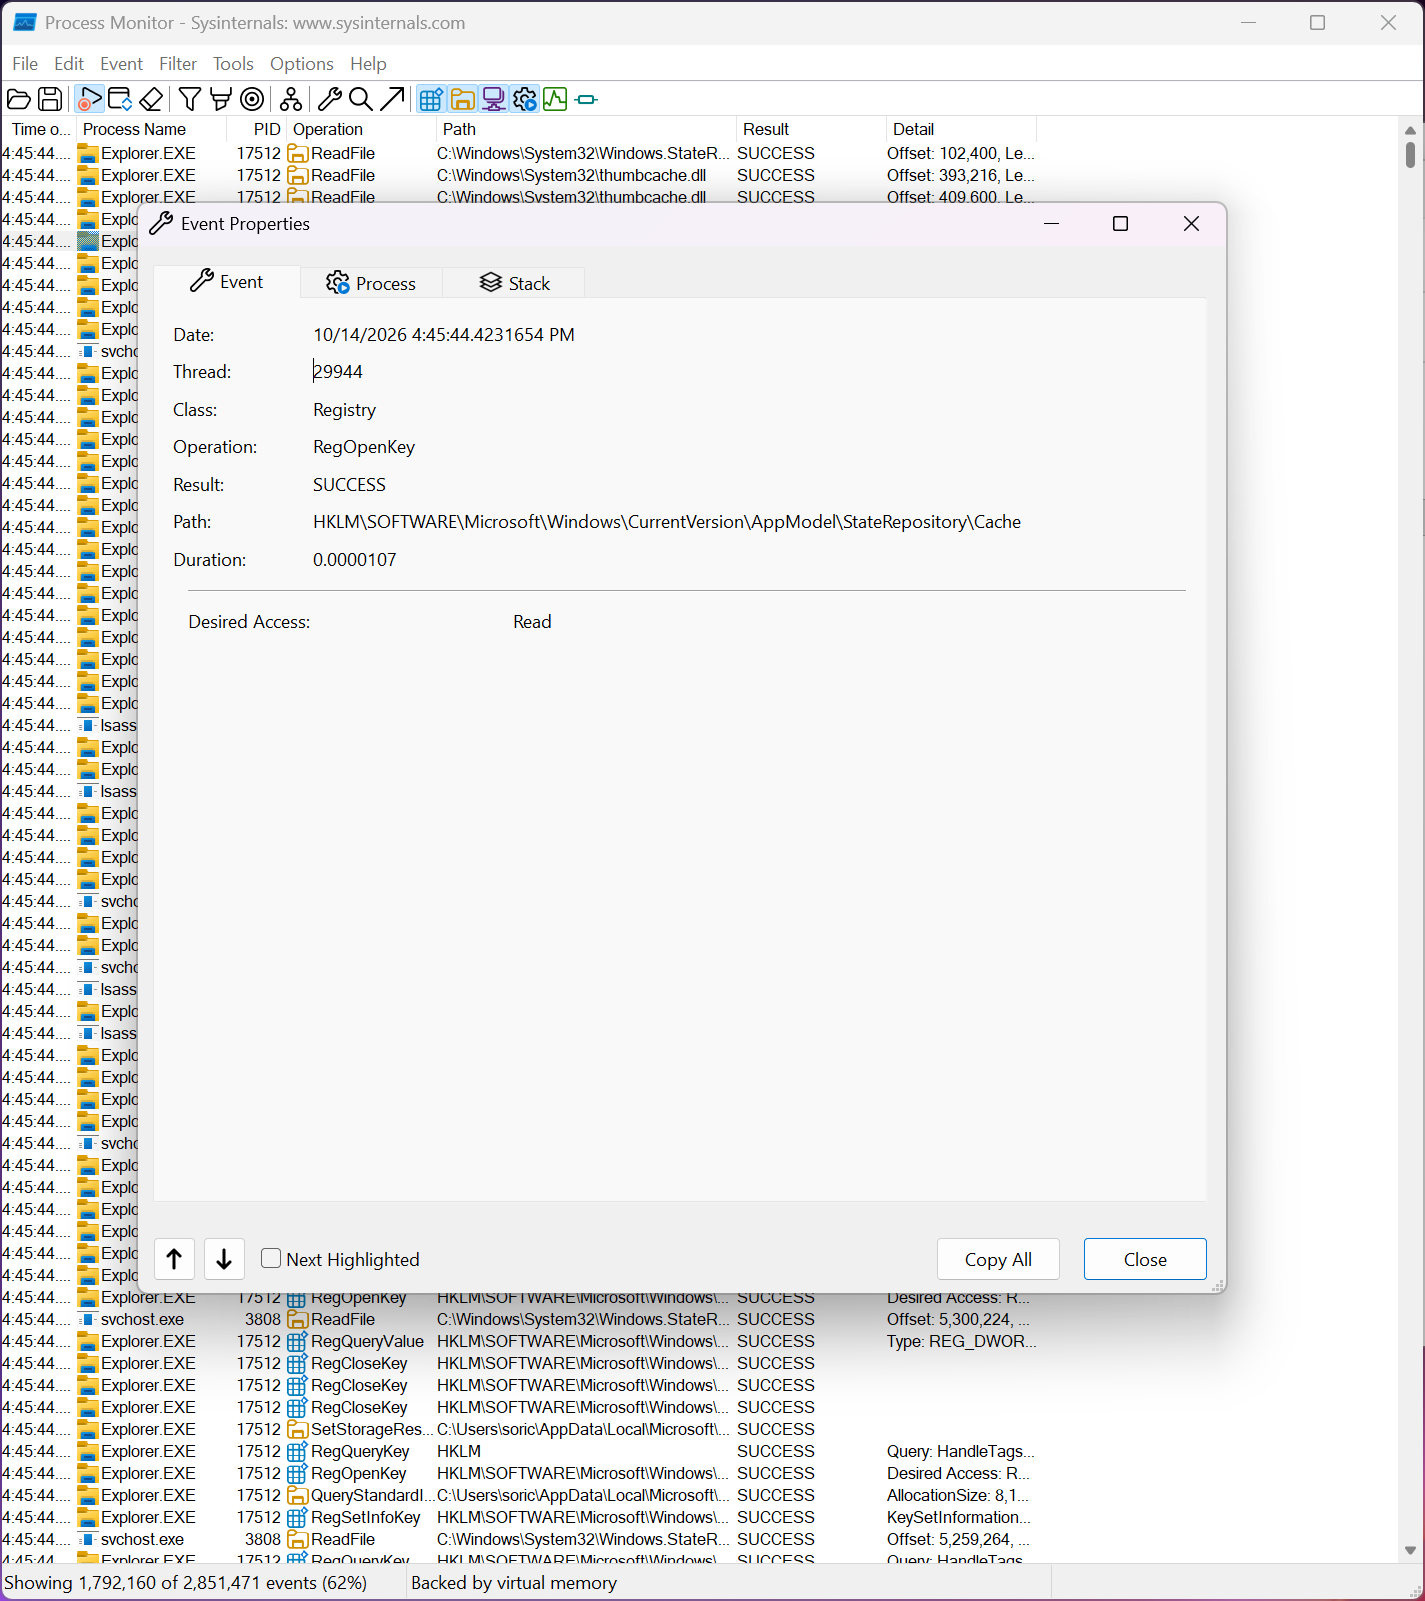
Every event carries the time to the microsecond, the process and its identifier, the operation, the path, the result and a detail column with what was read or written. Double-click a line and a dialog shows the full detail, the process’s command line and image, and the call stack that led to the operation, with function names once a symbol path is configured.
That stack is how you learn which part of a program made the call, not merely that the program did.
The filter is the whole technique
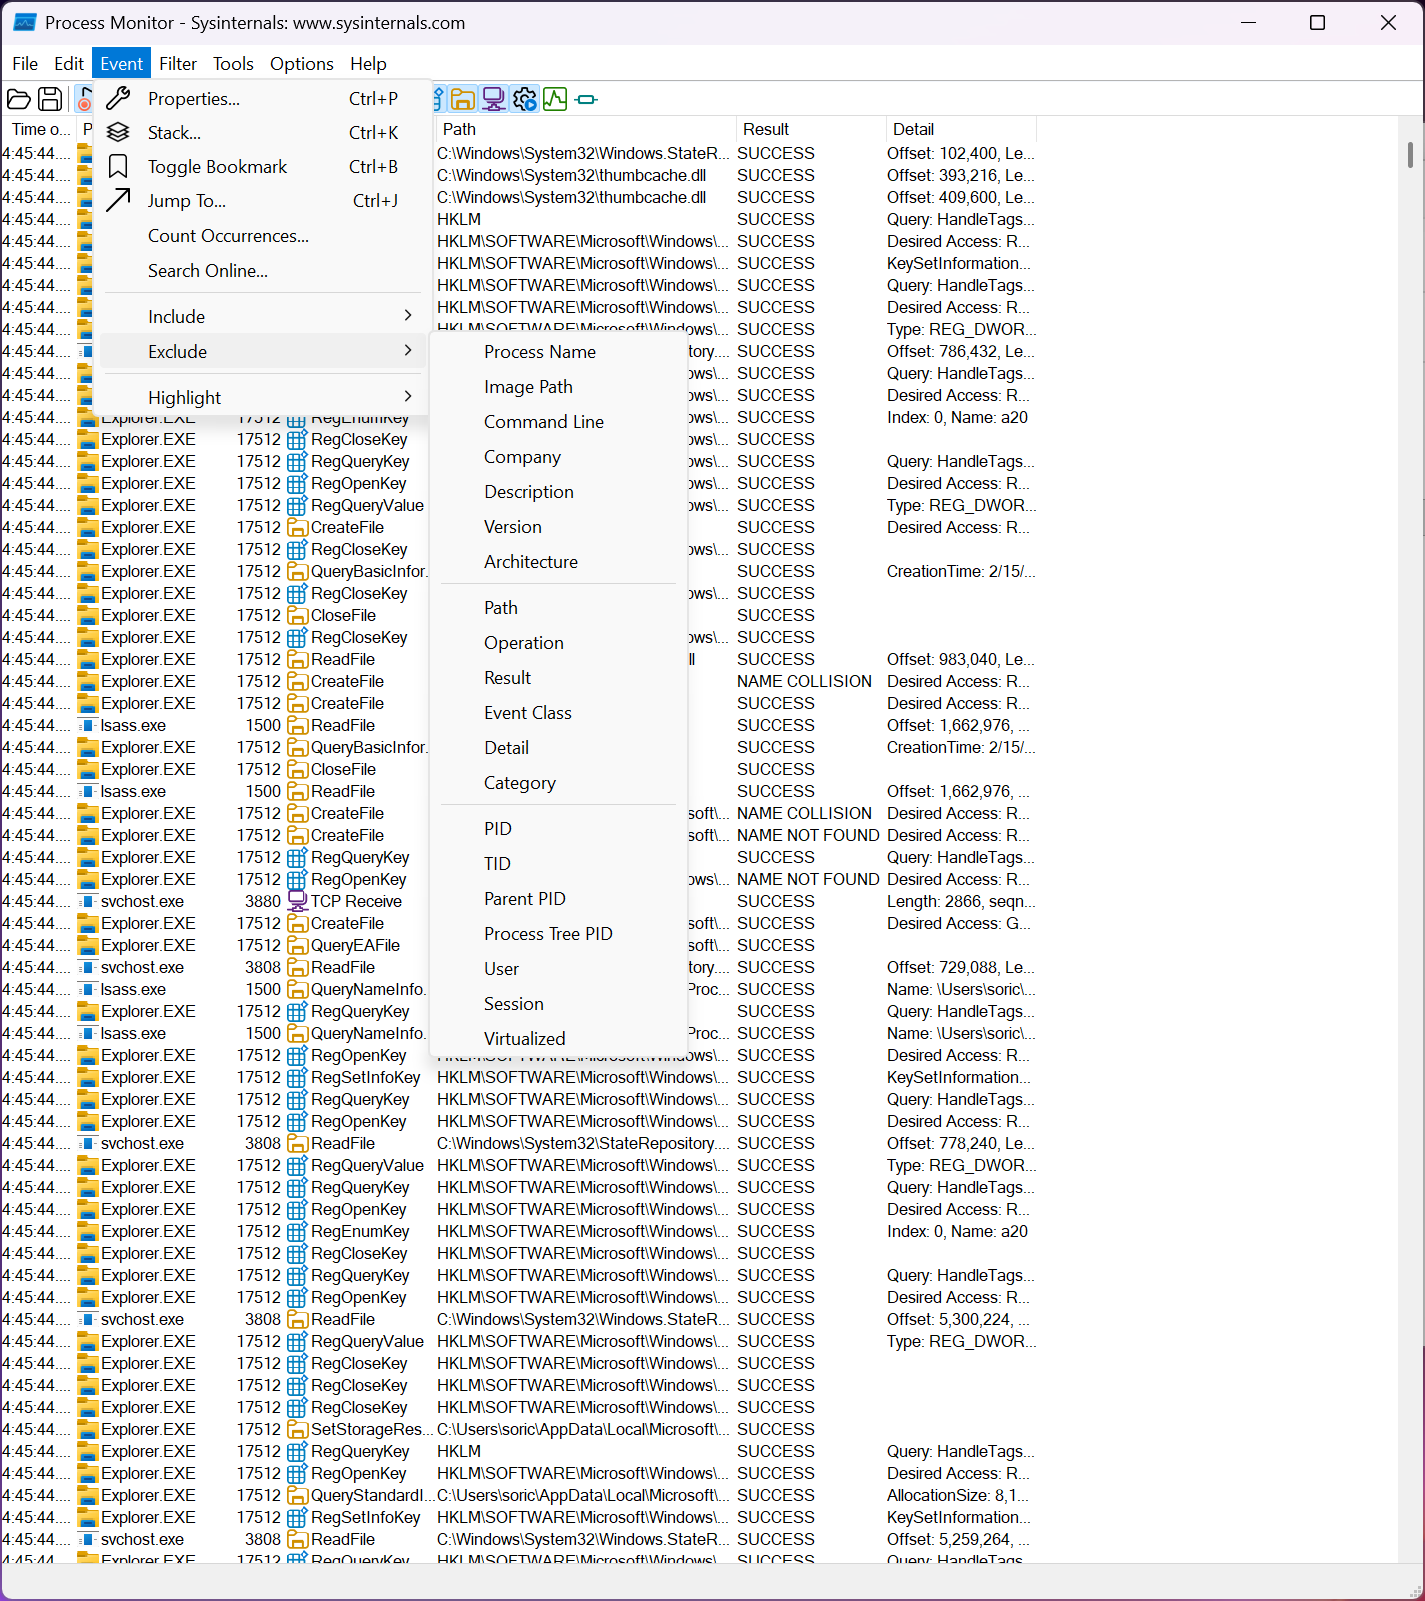
A minute of capture on an idle machine produces tens of thousands of events, and the skill of using Process Monitor is the skill of filtering. The Process Monitor filter dialog builds rules from any column. Process Name is a particular executable, Path contains a folder, Result is NOT FOUND, Operation is RegSetValue. Rules include or exclude, stack in a list, and can be saved and loaded as named sets for the problems you meet repeatedly. A right-click on any cell offers to include or exclude that value in one step, which is how most filters are built in practice.
Result is the column that solves the most cases. Filtering to NOT FOUND, ACCESS DENIED or PATH NOT FOUND shows every attempt to reach something that was not there or not allowed.
A program that fails to start almost always leaves one of those three in the last lines before it exits. Highlighting colours matching lines without removing the rest, for keeping context.
And Drop Filtered Events, an option in the Filter menu, throws away excluded events at capture time rather than storing them, which keeps a long capture from swallowing the disk.
The process tree and the counting tools
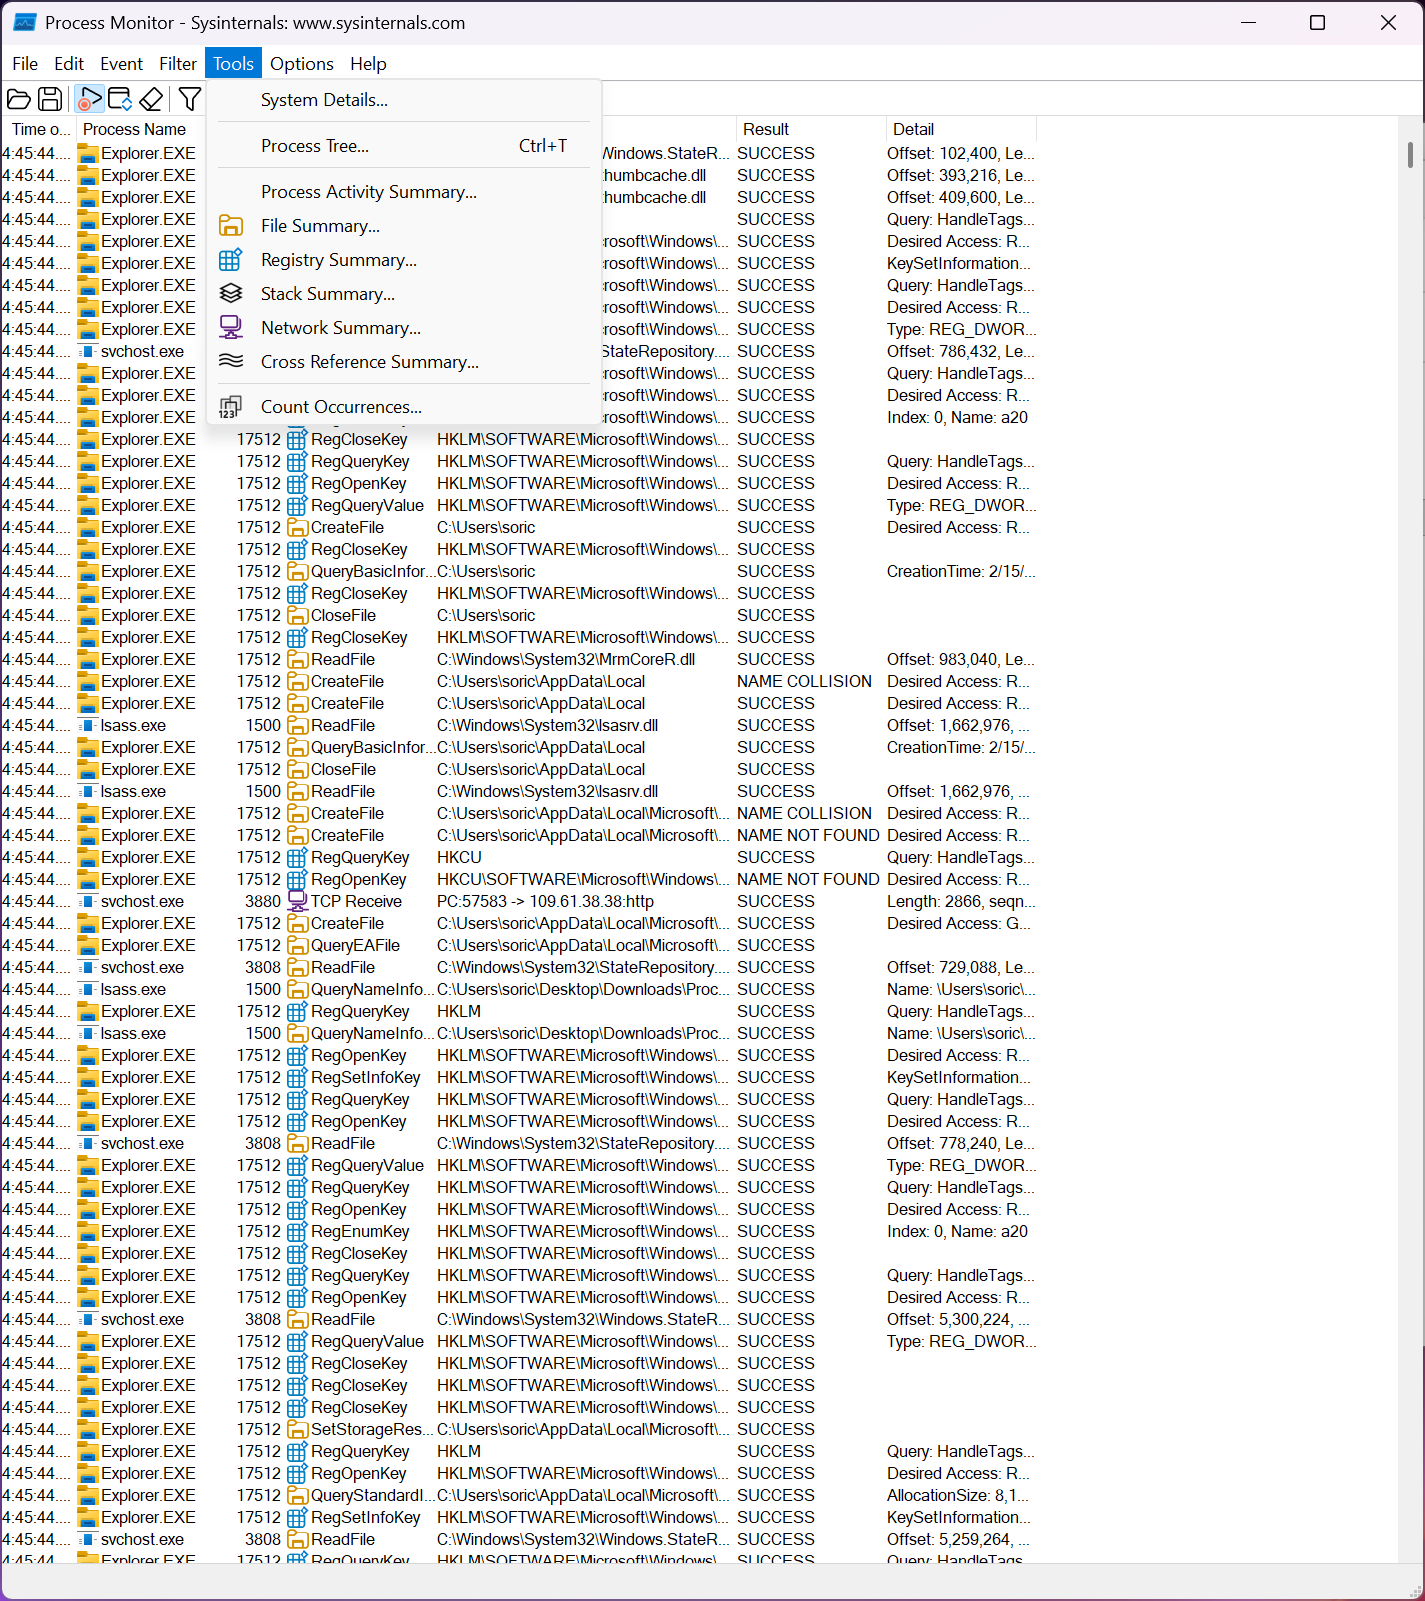
The Process Monitor Process Tree shows every process seen during the capture as a hierarchy with its parent and lifetime and command line. It includes processes that started and exited in a second, which the live tools never catch. Clicking a process there filters the main view to it. The Count Occurrences tool counts values in any column, so a question such as which registry keys does this program touch most gets a sorted list in a moment.
Jump To, on a registry or file line, opens the registry editor or the file’s folder at that exact location.
Saving, exporting and sharing a capture
A capture can be saved in the program’s own format with everything intact, or exported to CSV or XML for a spreadsheet or a script. Bookmarks mark lines to return to. And a saved capture opens on any other machine.
A technician can ask a user to record a problem and send the file, then read it at a desk with symbols and a large screen.
Boot logging and the problem that happens before login
Some problems occur before anyone can start a tool. A service fails during startup, a driver refuses to load, a login script hangs. Enable Boot Logging and Process Monitor installs its driver to start with the system. It records everything from the first moments of boot until the program is next launched, at which point it offers to save the log. It can include profiling events during boot as well. A boot capture is large and answers questions nothing else can, such as what the machine did during the ninety seconds before the desktop appeared.
For a permanent record of process activity rather than a session, a driver that writes process events to the event log is the right tool. Related to boot logging is the option to keep capturing with the window closed, and a command line for starting a capture with a backing file and a filter loaded. A scheduled task can then record a window of activity around a known failure time.
Profiling and stack traces
The profiling event, off by default, samples every thread’s stack at an interval, either every second or ten times a second, and records it. Filtered to one process over a period of slow behaviour, the resulting stacks show which functions were on the stack most often. It is a rough profiler that needs nothing installed in the program under study. Combined with the file and registry events it explains slowness that is really a thousand small reads of the same key.
Stacks resolve to function names only when a symbol path is set in Options, pointing at a symbol server and a debugging library, and until then they show module offsets. Setting that up takes ten minutes and turns the stack column from a curiosity into the most informative thing in the capture.
What it is not
Process Monitor shows operations and their results. It does not show the contents of a network packet, which is a packet analyzer territory. It runs when you run it and stops when you stop it, and the capture lives in memory until you save it. A capture left running for hours on a busy machine eventually exhausts memory unless a backing file is set.
It also asks something of the person at the keyboard. The first capture is overwhelming, the filter dialog rewards practice, and the answer is rarely on the first screen. People who learn it never work without it. People who open it once and see fifty thousand lines usually close it.
Conclusion
Process Monitor is for the support engineer, the administrator and the analyst who has a machine doing something nobody can explain and needs the line that says why. Learn the filter dialog, set the symbol path once, and it answers questions about missing files, reverted settings and unexplained slowness that no other desktop tool can reach.
It is not for a casual look at what is running, which its sibling does better, and it punishes anyone who expects the answer without filtering. Accept an hour of learning and it becomes the tool you open first, because everything that happens on the machine passes through it.
Pros & Cons
- Captures every file and registry operation, plus process and network activity, in real time with the result
- Filters on any column, saved as sets, with one-click include and exclude from any cell
- Call stack for every operation once symbols are configured
- Process tree shows short-lived processes the live tools miss
- Boot logging records activity from the first moments of startup
- Saved captures open on any machine for remote troubleshooting
- Overwhelming without filters and a steep first hour
- Captures live in memory and grow fast without a backing file
- Stack traces need a symbol path set up first
- No packet contents and no permanent logging
Frequently asked questions
Start a capture, reproduce the failure, stop, then filter Process Name to the program and Result to NOT FOUND, ACCESS DENIED or PATH NOT FOUND. The last such lines before the process exits usually name the missing file or key.
Every captured event is held in memory until saved. Turn off the event classes you do not need, enable Drop Filtered Events, and for long captures set a backing file in the File menu so events go to disk.
Yes. Enable Boot Logging in the Options menu and restart. The driver records from early boot, and the log is offered for saving the next time the program starts.
No symbol path is configured. In Options, Configure Symbols, point at a debugging library and a symbol server path, and the stacks resolve to function names.
Right-click any event from that program and choose Include on the Process Name, or open the Filter dialog and add Process Name is followed by the executable. Save the filter as a set if you will use it again.


