Wireshark

 (32 votes, average: 4.59 out of 5)
About Wireshark
When network engineers need to know what is actually happening on a wire, they open Wireshark. It captures every packet that crosses the network interface, decodes more than 3000 protocols from the link layer up to application-level formats, and presents the result in a three-pane window where you can see the raw bytes, the structured fields, and the protocol hierarchy at the same time. There is nothing in the open source world that approaches its breadth of protocol support, and the commercial alternatives mostly target narrow use cases rather than the general-purpose packet dissection this application handles.
The software started life in 1998 as Ethereal, written by Gerald Combs while working as a network professional who needed a better tool than what existed at the time. The project changed names to Wireshark in 2006 over a trademark dispute, and has been continuously developed since by a community that now numbers hundreds of contributors.
The codebase is GPL v2, the binaries are signed, and major version updates happen on a roughly six-month cadence with point releases between.
The three-pane interface and what each pane is for
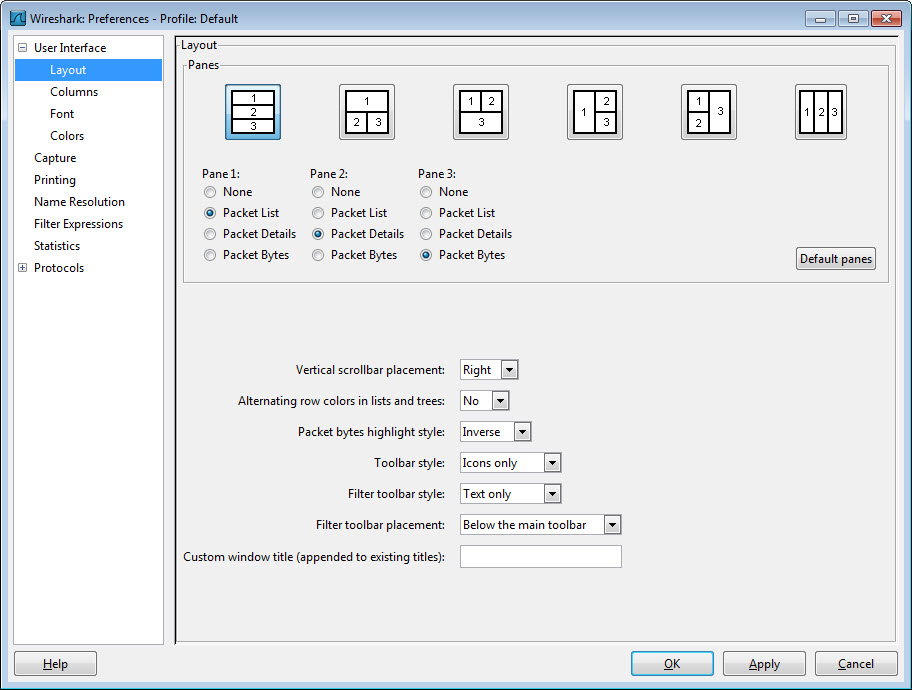
The main window is divided into a packet list, a packet details tree, and a packet bytes view. The packet list shows one row per captured frame with columns for time, source, destination, protocol, length, and a brief info summary. Click a row and the details pane expands the decoded structure of that single packet, with protocol layers nested from the lowest (Ethernet, 802.11) through IP, transport, and application layers. The bytes pane shows the raw hexadecimal content, with bytes highlighted to match whichever field you select in the details pane.
This layout sounds obvious once described but the synchronization between the three panes is what makes the application effective. Click on a TLS record in the details tree and the bytes pane highlights exactly which hex bytes make up that record.
Click on a single byte in the hex view and the details pane jumps to the field that owns that byte. For learning a new protocol or debugging an unexpected packet, this bidirectional navigation between abstraction levels is more valuable than any single feature.
Capture filters versus display filters and why they are different
This is the part most newcomers stumble on, and the documentation does not always make it clear. Wireshark has two filter languages, used at different times and with different syntax.
Capture filters use BPF (Berkeley Packet Filter) syntax, the same syntax tcpdump uses, and they decide which packets get written to the capture file in the first place. A capture filter like tcp port 443 and host 192.168.1.10 tells the kernel to discard everything that does not match before it ever reaches Wireshark, which keeps capture files small and reduces processing overhead on busy networks.
Display filters use Wireshark’s own syntax, which is more expressive and reads more like a programming language. tcp.flags.syn == 1 && tcp.flags.ack == 0 finds TCP SYN packets without ACK (connection attempts). http.response.code >= 400 finds HTTP error responses. dns.qry.name contains "example" finds DNS queries for any name containing “example”. The display filter operates on packets already captured, runs against the dissected fields, and can be changed without recapturing.
You can write capture filters in BPF if you know what you are looking for ahead of time. You can write display filters in the richer syntax after the fact. Mixing them up (trying to use display filter syntax for capture, or BPF for display) is the most common beginner error and produces silent failures rather than helpful errors.
Compared to a dedicated HTTP debugger like Charles, this two-layer filter system feels heavier, but it is the price of working at every layer of the stack rather than just the application layer.
The dissector ecosystem and 3000+ protocols
The protocol decoders are the heart of the application. Each protocol has a dissector, a piece of code that knows how to take a raw byte stream and turn it into structured fields with labels. The dissector for IPv4 knows that bytes 12 through 15 are the source address. The TLS dissector knows how to walk through record types, cipher suites, and extensions. The QUIC dissector handles the encrypted transport that backs HTTP/3.
What separates Wireshark from amateur packet sniffers is the depth and quality of these dissectors. Industrial protocols like Modbus, DNP3, and IEC 61850 are supported. VoIP protocols including SIP, RTP, and the RTCP feedback messages are decoded with statistics views specific to call quality analysis. Routing protocols (BGP, OSPF, IS-IS, EIGRP) decode down to individual route announcements. Even Bluetooth, USB (on Windows via USBPcap), and ZigBee captures get the same treatment when you have appropriate capture hardware.
Lua scripting is available for writing custom dissectors when you encounter a protocol the built-ins do not handle. The Lua API is documented but not gentle, and most users never touch it. For the rare custom protocol case, it is there.
Following streams and reconstructing application data
The Follow Stream feature is what turns packet captures back into something legible. Right-click any TCP packet and Follow TCP Stream reconstructs the entire bidirectional conversation, with one side colored red and the other blue, showing the raw payload as if you had been reading the actual exchange. For HTTP, this shows headers and body content. For unencrypted protocols like FTP or Telnet, it shows the command exchange directly. For binary protocols, it shows the hex.
The feature extends to UDP, TLS (when you have the keys), HTTP, HTTP/2, and QUIC. Reconstructing application data from individual packets used to require manually assembling the byte stream by selecting packets and stripping headers. Now it is two clicks.
For TLS decryption specifically, the application reads the SSLKEYLOGFILE environment variable that browsers like Chrome and Firefox can write to when launched correctly. Set the variable, restart the browser, and TLS sessions become transparent to Wireshark while remaining encrypted on the wire. This is the modern way to debug HTTPS traffic without setting up a debugging proxy that intercepts and re-signs connections.
TShark, dumpcap, and the command-line family
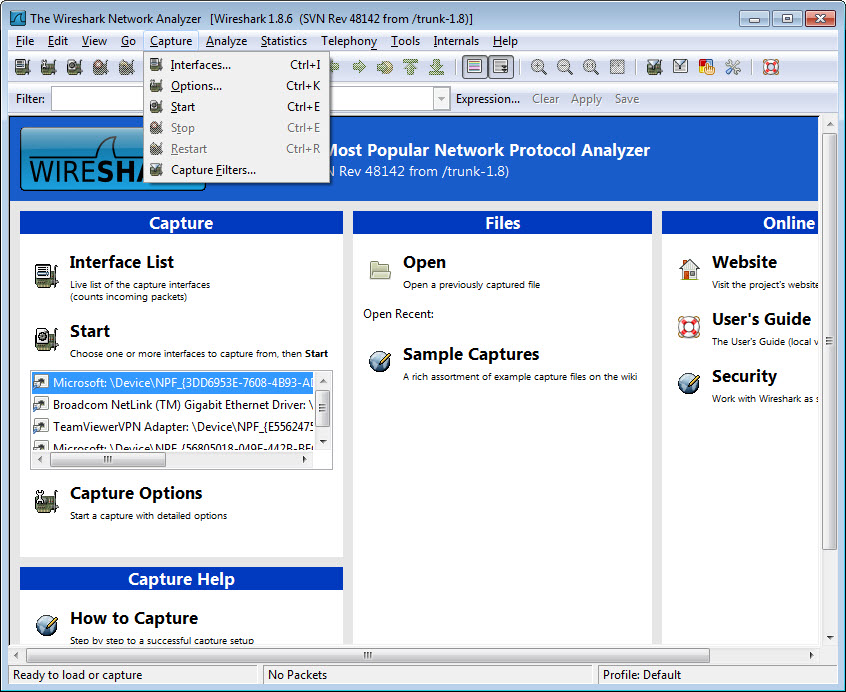
The GUI is one application in a family of tools. TShark is the command-line version, useful for scripted analysis and remote captures over SSH. Dumpcap is the lightweight capture engine that the GUI itself uses under the hood, which can be invoked directly when you want to capture without the resource overhead of the full interface. Editcap edits capture files (splitting, merging fragments, anonymizing addresses). Mergecap combines multiple files into one. Capinfos prints summary statistics. Text2pcap converts hex dumps into capture files.
For automated workflows, the typical pattern is dumpcap or TShark for unattended capture, then the GUI for human analysis. TShark can also output statistics directly, for instance tshark -r capture.pcapng -q -z conv,tcp produces a TCP conversation summary. This makes the application usable in CI pipelines, monitoring scripts, and remote forensic analysis where opening the GUI is impractical.
I/O graphs, statistics, and the expert system
Beyond raw packet display, the Statistics menu contains analyses that summarize what is in a capture. Protocol hierarchy shows the percentage breakdown of protocols. Conversations lists endpoint pairs sorted by bytes or packets exchanged. Endpoints shows individual addresses with traffic totals. I/O Graphs plots packet rate over time, optionally split by filter, useful for visualizing traffic patterns and spotting bursts.
The Expert Info system is the underrated feature. It scans the capture and flags anomalies the dissectors recognized as problematic. TCP retransmissions, duplicate ACKs, fast retransmits, window updates, malformed packets, unusual sequence numbers. Each flagged event links back to the packet that triggered it. For diagnosing network problems where you know something is wrong but not what, scanning the Expert list is the fastest path to a hypothesis.
Network engineers troubleshooting application performance often start with Expert Info before they touch a single filter.
USB capture, wireless capture, and the hardware question
On Windows, USB packet capture works through USBPcap, a kernel driver that ships separately. With it installed, USB devices appear in the interface list and you can capture the traffic between the device and the host. For debugging USB peripherals, this is one of the few software tools available that does not require an external hardware analyzer.
Wireless capture is more complicated. Most consumer Wi-Fi adapters on Windows do not support monitor mode without specific drivers, which is why serious wireless work often happens on Linux or with specialized adapters. The application supports monitor mode where the adapter does, decodes 802.11 management frames, and integrates with WPA decryption when you have the PSK.
File formats and pcapng
The default capture format is pcapng, which replaced the older pcap format. pcapng adds per-packet metadata, multiple interface support in a single file, and named annotations. Most modern tools support pcapng directly. The older pcap format is still supported for reading and writing, but the application uses pcapng by default.
Capture files can grow large quickly on busy networks. The Capture Options dialog includes ring buffer settings (write N files of M megabytes each, then rotate), which prevents runaway disk usage during long captures.
For multi-day captures where you only care about recent traffic, this is essential.
Color rules and visual scanning
Each packet row in the list gets a background color based on a configurable rule set. The defaults color TCP retransmissions in black-on-red, ARP traffic in green, ICMP errors in pink, and so on. With practice you stop reading the protocol column and just scan colors, which lets you visually identify problem patterns in a packet list of thousands of rows.
The rules are user-editable. You can add custom coloring for specific filter expressions, which is useful for highlighting traffic from particular hosts or matching application-specific patterns. The rule order matters because the first matching rule wins, so more specific rules need to come before more general ones.
Conclusion
Wireshark is the right tool for users who need to understand what is actually happening on the wire rather than what an application reports happened. Network engineers diagnosing performance problems, security analysts investigating incidents, protocol developers verifying their own implementations, and students learning how networks actually work will all find this application central to their workflow. The protocol breadth and analysis depth set the standard that other tools are measured against.
What you accept by using it is a learning curve that the application does not soften. The two filter languages, the dense documentation, and the expert features that assume you already know what they mean all reward investment over time but punish dabbling.
For users who want to glance at network traffic occasionally and move on, simpler tools fit better. For users who treat packet analysis as part of the job, this is the workspace where that work gets done.
Features & benefits
Pros & Cons
- 3000+ protocol dissectors covering everything from Ethernet to industrial control protocols to modern QUIC and HTTP/3
- Display filter language is expressive and operates on dissected fields, not just byte patterns
- Three-pane synchronized view connects raw bytes, decoded fields, and protocol hierarchy
- Follow Stream reconstructs application data from packet captures with one click
- TLS decryption support via SSLKEYLOGFILE for modern browser-based HTTPS debugging
- Command-line family (TShark, dumpcap, editcap) enables scripted and automated workflows
- Expert Info system surfaces network problems automatically without manual filtering
- Open source under GPL v2 with binaries signed and a well-funded foundation backing development
- Two different filter languages (BPF for capture, Wireshark syntax for display) cause repeated confusion for newcomers
- Performance degrades on captures over a few hundred megabytes, making analysis of long captures sluggish
- USB and wireless monitor-mode capture require additional drivers and hardware support
- Documentation is comprehensive but reads like a reference manual, with limited tutorial paths
- The breadth of features means most users use a small fraction of what is available
- Lua dissector API is documented for experienced developers but unforgiving for occasional scripters
Frequently asked questions
The application can capture USB traffic on Windows with the USBPcap driver, Bluetooth traffic with appropriate adapters, wireless 802.11 frames with monitor-mode capable hardware, and named pipe data on Windows. Anything that produces packetized communication and exposes a capture interface can usually be captured.
Capture filters run in the kernel using BPF, a compact bytecode language that has to be lightweight enough to evaluate at line rate. Display filters run in user space against fully dissected packets, where richer syntax and field-aware comparisons are practical. The split exists because of where each filter runs in the pipeline.
Yes, if you have access to the session keys. Modern browsers can write keys to a file by setting the SSLKEYLOGFILE environment variable before launch, and the application reads that file to decrypt captured TLS sessions. Without the keys, encrypted traffic remains opaque.
tcpdump is a command-line capture tool with basic display capabilities. The application provides a graphical interface, a much larger protocol decoder library, statistics views, and post-capture analysis tools. TShark, the command-line version included in this package, is a closer comparison to tcpdump with full dissector support.
No, the application is passive. It reads packets that arrive at the network interface but does not generate, modify, or block traffic. This is different from a proxy debugger like Fiddler, which acts as a man-in-the-middle and can modify requests in transit.
Performance is comfortable up to a few hundred megabytes of capture. Beyond that, sorting, filtering, and stream reconstruction become slow. For larger captures, the recommended approach is to use TShark or editcap to filter or split the file before opening in the GUI.
On a hub or with port mirroring (SPAN) configured on a managed switch, the application sees all traffic on the segment. On a normal switched network without port mirroring, it sees only traffic to and from the capturing host plus broadcast traffic. The architecture of the network determines what is visible, not the application itself.