

Process Explorer
About Process Explorer
Process Explorer is a task manager that answers the question Task Manager cannot. Which program has this file open? Which DLL did that process load, and from where? Who started this svchost.exe, and what services live inside it? It shows every running process as a tree with its owning account, and a lower pane that lists either the handles a process holds or the modules it has loaded, with a search that runs across all of them at once.
It comes from the same family as Autoruns and Sysmon, runs from a single executable with nothing to install, and has been the tool support engineers reach for when “end task” is not enough. Process Hacker covers similar ground with a more aggressive set of controls, but Process Explorer is the one whose readings people trust when they write up an incident.
The process tree and what the colours mean
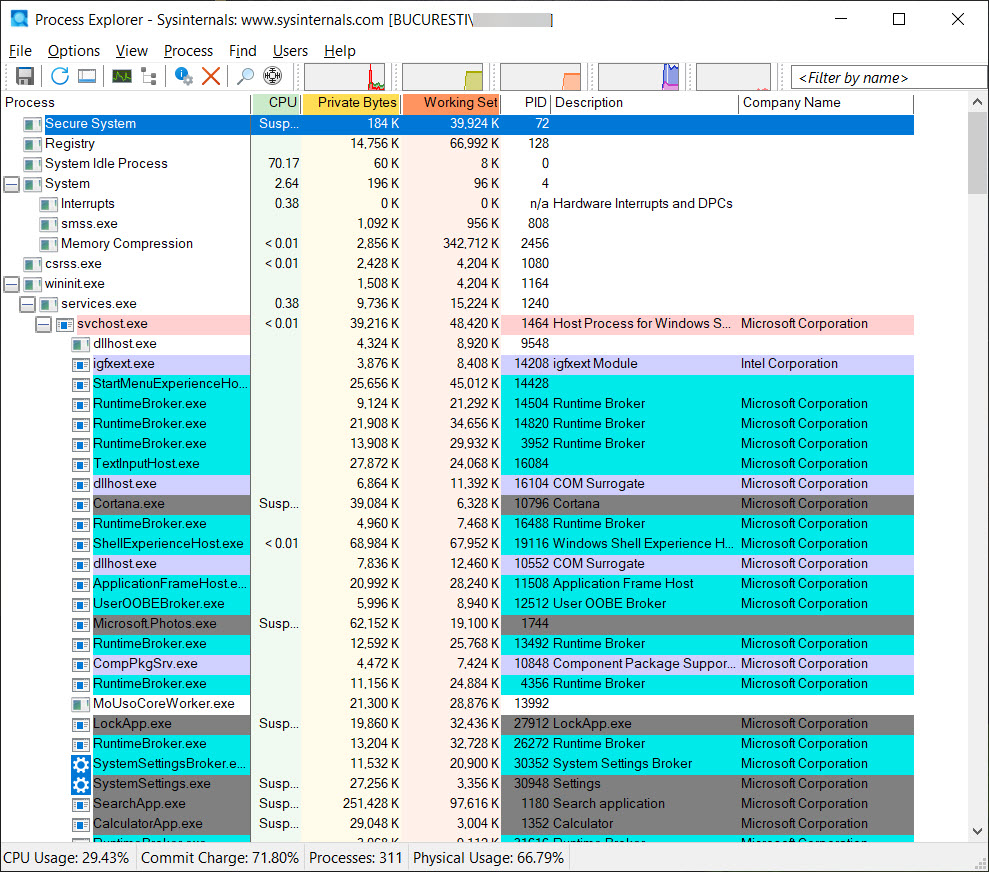
The top pane of Process Explorer is a tree rather than a flat list. Every process sits under its parent, so a browser’s dozen renderer processes fold under the browser, and a command prompt that was launched by a scheduled task shows exactly that lineage. That alone catches most masquerading malware, since a process named after a system component that was started by explorer.exe is wrong by definition.
The row colours carry meaning. Pink is a process hosting services, and hovering over a svchost.exe row pops a tooltip listing the services inside it, which is the single most useful thing in the whole tool. Light blue is your own processes, purple is a packed or compressed executable (a common malware trait), dark grey is suspended, and brown is a process inside a job object. Green flashes when a process starts and red when it exits, for the second or so they remain in the list. Add the Command Line and Description columns and you have most of a triage sheet without opening a single dialog.
What the tree never shows is the past. A process that exited a minute ago is gone, and for a record you need a driver that writes process activity to the event log running alongside.
Finding out who has a file open
Press Ctrl+F, type a filename, a folder name or a DLL name, and the search returns every process holding a handle to it or a module by that name. That is the answer to “the file is in use by another program” and to the folder you cannot delete because something has its working directory there. Select the result and the lower pane jumps to the handle.
The lower pane itself toggles between handle view (Ctrl+H) and DLL view (Ctrl+D). Handle view lists files, registry keys, plus mutexes and events, each by name. DLL view lists every loaded module with its path and version, which is how you find the badly behaved shell extension that is crashing your file manager. You can close a handle from here, and you should almost never do it, since the owning process does not know you took it away and will misbehave in ways that look like a different bug.
The Properties dialog
Double-click a process in Process Explorer and the Properties dialog opens with a row of tabs. Image shows the full path, the command line, the current directory, the parent, the user, the autostart location if the process was started at logon, and a Verify button for the signature. Performance and Performance Graph cover CPU, memory and I/O for that one process over time, and GPU Graph does the same for graphics load.
Threads is the tab that separates this from a task manager. It lists every thread with its start address and CPU time, and a Stack button shows what the thread is actually doing, which is how you find out that a frozen application is waiting on a network share. The stacks only resolve to readable function names once you point Options at a debugging symbols path, and until then you see addresses. TCP/IP lists the process’s open connections and listening ports, Strings dumps printable text from the image and from memory, and Services lists what a host process is running.
The connections tab tells you an endpoint exists, not what crosses it, and for that you still want a packet analyzer.
Signatures and VirusTotal
Two options in Process Explorer turn the process list into a reputation check. Verify Image Signatures adds a column showing whether each executable carries a valid code signature and from whom. Check VirusTotal.com submits the hash of every image to VirusTotal and adds a column with the result as a fraction, 0/77 meaning none of the engines flagged it. A further option submits the file itself when the hash is not known.
Take the column for what it is. A hash lookup catches known malware and says nothing about fresh samples, and the service periodically returns Unknown for everything for a day or two when its side throttles requests, which has sent more than one panicked forum thread looking for a virus that was not there.
Used together with the signature column and the parent process, it is a fast first pass. Used alone it is a coin toss.
Suspend, kill tree, set priority, create dumps
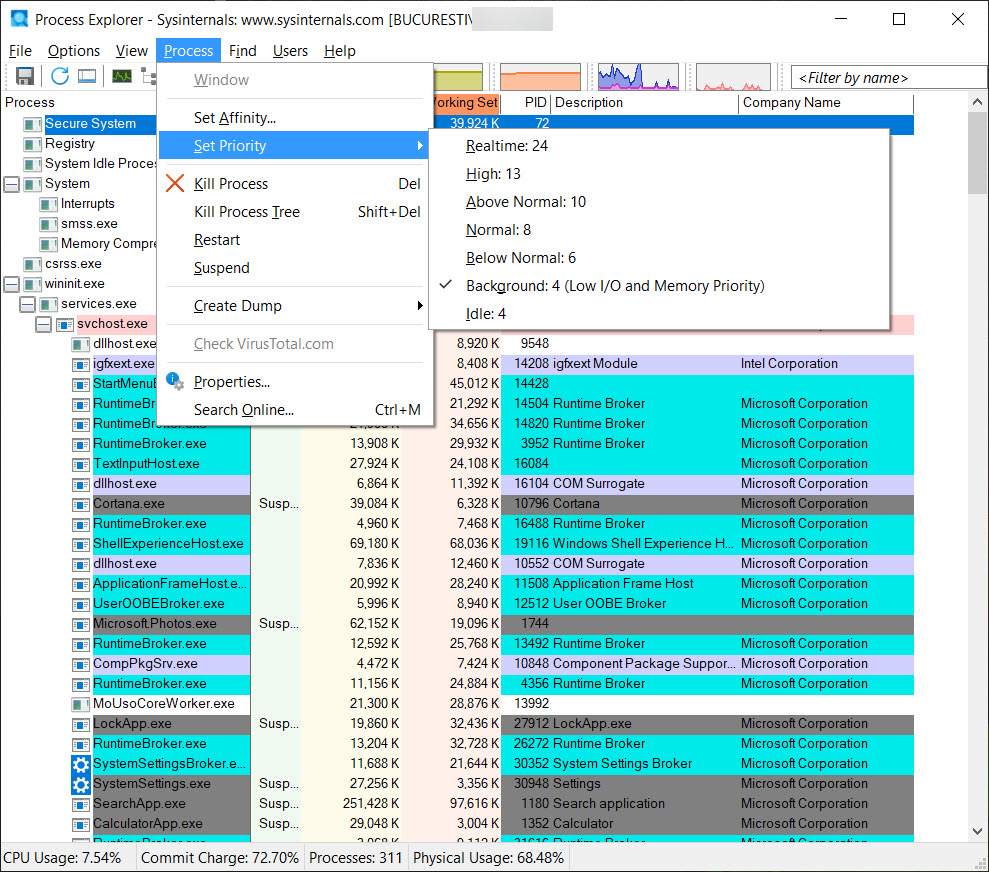
The Process menu goes beyond kill. Suspend freezes a process without ending it, which is how you stop ransomware in the middle of encrypting while you collect evidence, and Resume brings it back. Kill Process Tree ends a process and every descendant, so a stuck installer does not leave its helpers behind. Restart kills and relaunches with the same command line. Set Priority and Set Affinity change scheduling without a reboot, and Create Dump writes a minidump or a full memory dump for a debugger.
All of these will happily break a machine if pointed at the wrong row. Process Explorer trusts you completely, which is why Task Manager exists for everyone else.
System Information and the tray graphs
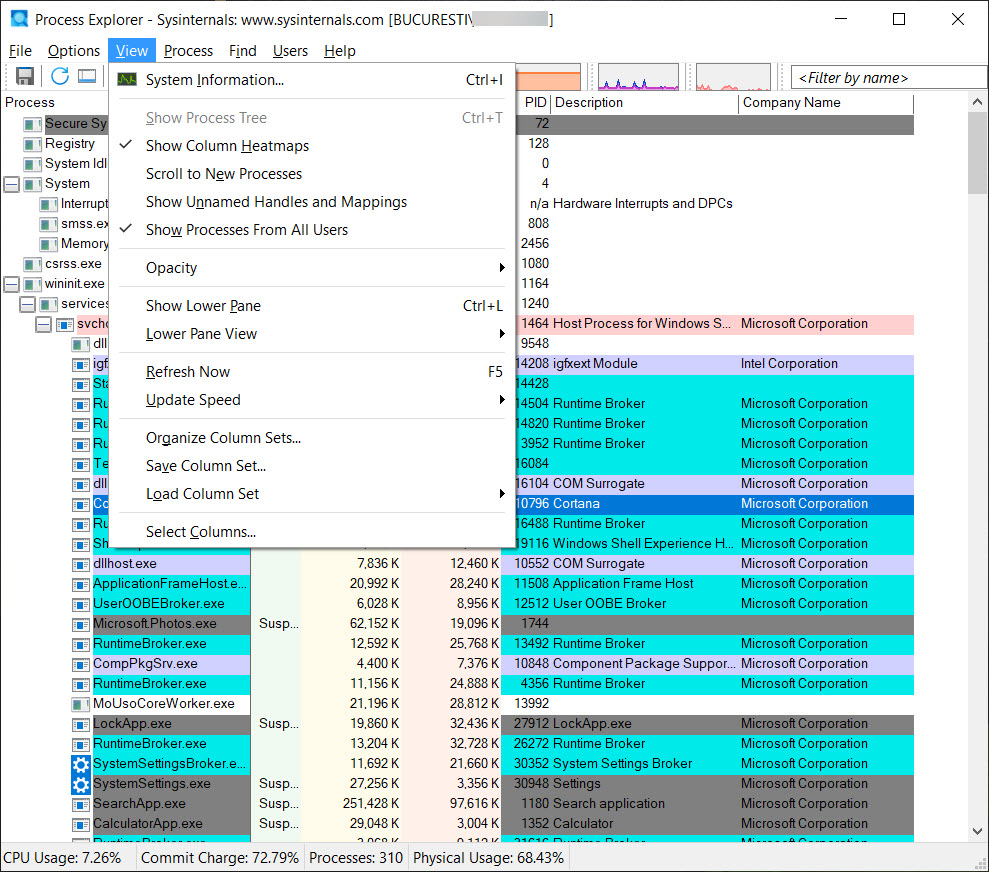
The System Information window in Process Explorer (Ctrl+I) shows CPU, memory, I/O and GPU as scrolling graphs with a history you can hover over to see which process was responsible for a spike. It also breaks CPU time into user and kernel and shows Interrupts and DPCs as pseudo-processes, so a driver eating a core shows up here when Task Manager attributes it to nothing. Physical memory, commit charge and the paged and non-paged pools are all on the same screen.
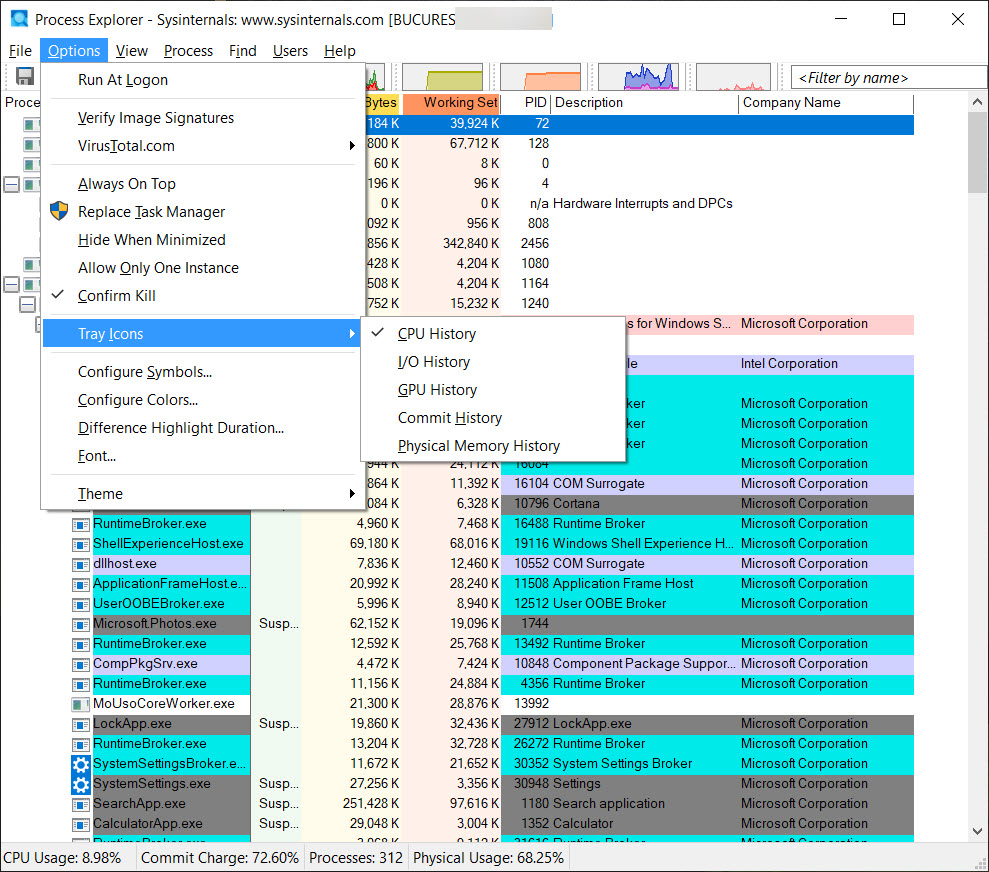
Minimise Process Explorer and it can leave one tray icon per graph, so a glance at the corner tells you whether the disk or the GPU is the thing that is busy. That is the mode most people end up running it in all day.
Replacing Task Manager, and running elevated
Options has a Replace Task Manager entry. It works by registering itself as the debugger for taskmgr.exe, so Ctrl+Shift+Esc and the Task Manager entry on the security screen both open this tool instead. Some antivirus products flag that registration because malware uses the same mechanism, so expect a prompt.
The other thing to know is that launched normally it shows details only for your own processes. Show Details for All Processes on the File menu relaunches it elevated, and you need that to see command lines and handles for system processes. Run it that way from the start and save yourself the confusion of an empty lower pane.
What it does not do
It shows autostart locations per process but does not let you edit or disable them, which is Autoruns territory. It has no notion of a network map, only per-process connections. And, as said, it keeps no log, so an intruder who was there an hour ago is invisible to it.
Knowing those edges is what keeps it from being oversold.
Conclusion
Process Explorer is for support technicians, administrators and anyone who has ever stared at Task Manager and wanted to ask it a follow-up question. Finding who holds a file, reading which services hide inside a host process, and checking a suspicious executable’s signature and reputation in one screen are things no built-in tool offers.
It is also a tool that assumes you know what you are doing, and gives you enough control to prove otherwise. Pair it with something that keeps a record, leave the handle-closing to people who have read the manual, and it will earn a permanent place in the tray.
Features & benefits
Pros & Cons
- Process tree with parent lineage and service tooltips on host processes
- Ctrl+F finds which process holds any file, folder or DLL
- Thread stacks show what a hung application is waiting on
- Signature verification and VirusTotal columns in the process list
- Suspend, kill tree, restart, affinity, memory dump, all from one menu
- Per-graph tray icons for CPU, memory, disk and GPU
- Shows only the present state, with no history or logging
- Closing handles or suspending system processes can destabilise the machine
- Thread stacks are unreadable until a symbols path is configured
- VirusTotal lookups are hash-only and sometimes return Unknown for days
- Antivirus may object to the Task Manager replacement mechanism
Frequently asked questions
Press Ctrl+F, type part of the file or folder name and search. Every process holding a handle to it is listed. Select a result and the handle is highlighted in the lower pane.
Usually the service itself is throttling or rejecting lookups, and it clears on its own within a day or two. Check the signature column in the meantime. If only a few entries read Unknown, the hash has never been seen and you can submit the file from the Options menu.
It is running without elevation and can only inspect your own processes fully. Choose Show Details for All Processes from the File menu to relaunch it with administrator rights.
The feature registers the tool as the debugger for taskmgr.exe, a mechanism that malware also abuses to hijack programs. The registration is legitimate here, and you can revert it from the same menu entry.
Open Options, choose Configure Symbols, point it at a copy of dbghelp.dll and set a symbols path that includes a symbol server. Until that is done, stacks show raw addresses rather than function names.


