OCCT


 (37 votes, average: 2.70 out of 5)
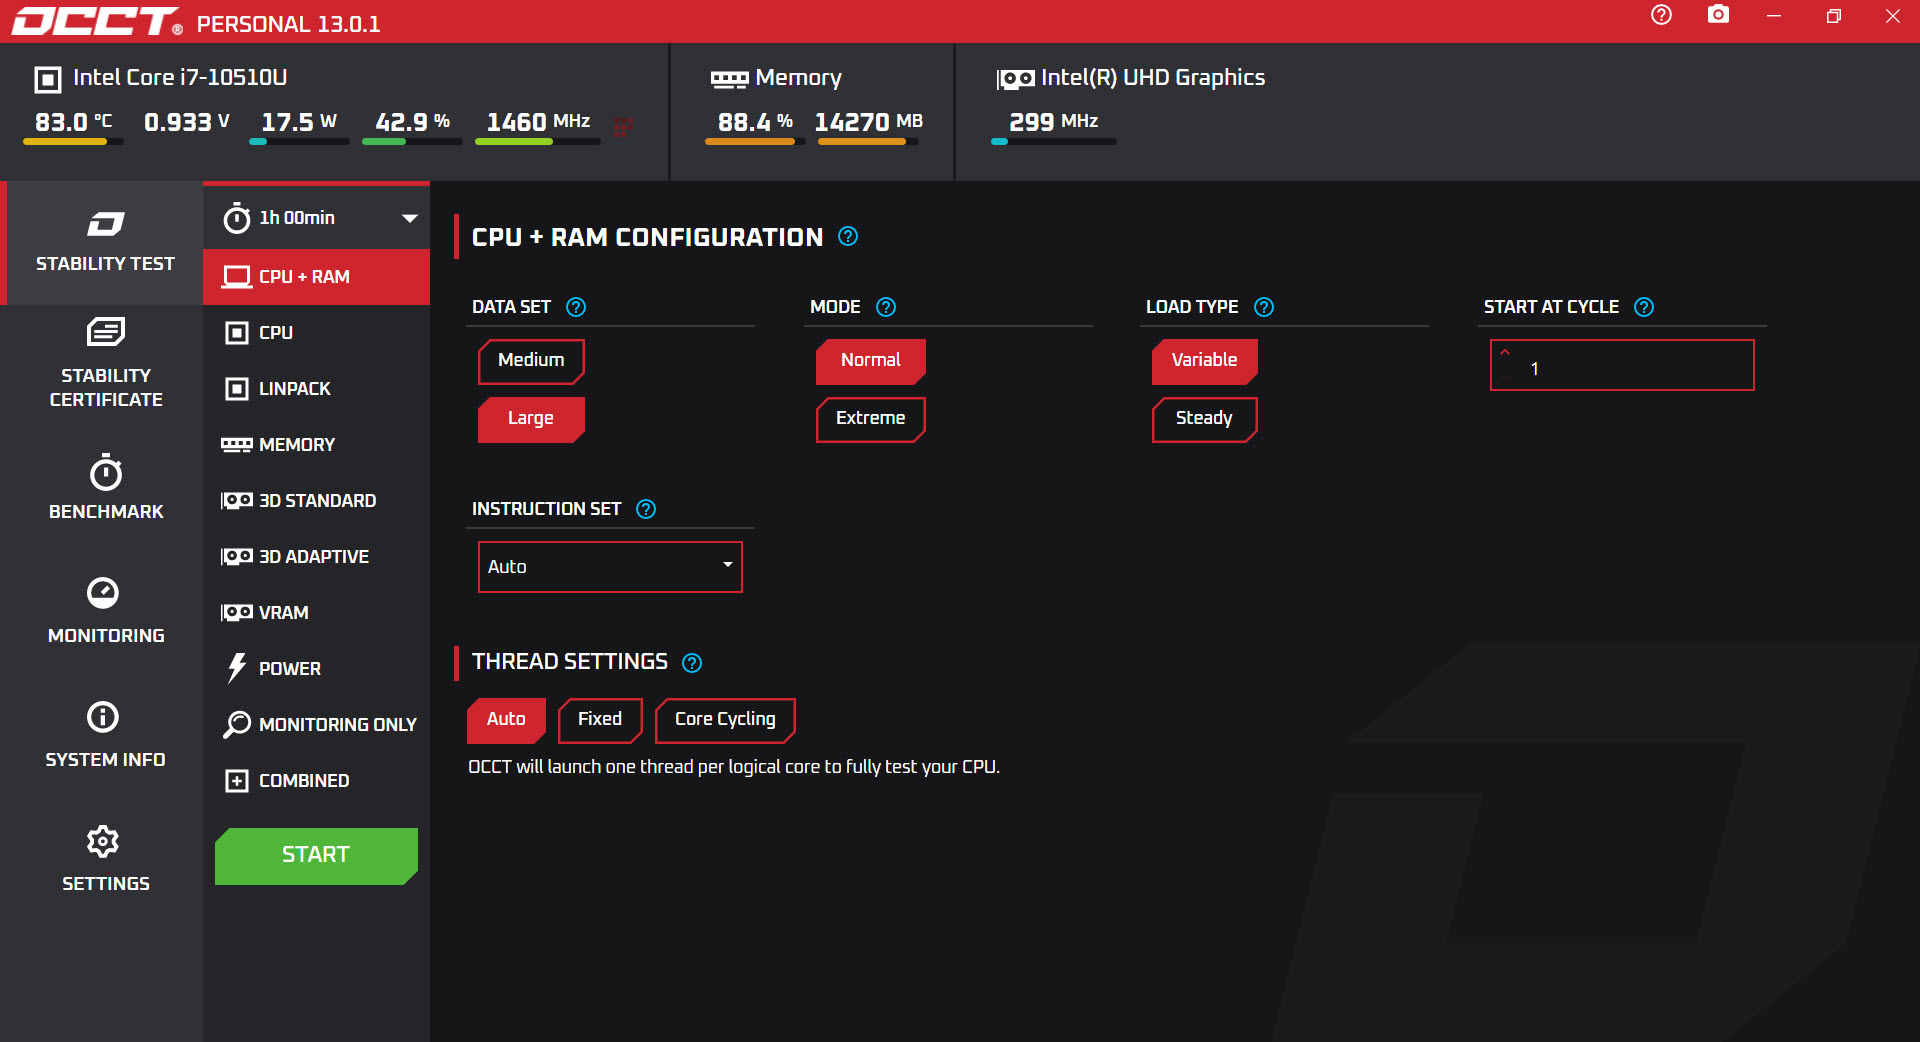
About OCCT
There are two questions that come up for anyone who has just built a PC, finished an overclock, replaced a power supply, or noticed something behaving oddly under load. The first is “does the hardware actually work under stress, not just sitting at the desktop.” The second is “what is happening to temperatures, voltages, and clocks while it is being stressed.” Most people answer these with two separate tools, one to apply load and one to watch the sensors.
OCCT is built around the idea that the same tool should do both, with the sensor monitoring and the stress testing tied to each other so that crossing a thermal limit can stop the test before the hardware actually has time to be unhappy about it.
OCCT stands for OverClock Checking Tool, which describes its origin accurately but undersells its current scope. The application is now a general hardware diagnostic suite covering CPU stress, GPU stress, memory stress, VRAM stress, power supply stress, and continuous sensor monitoring, with safety thresholds that abort tests automatically if anything goes wrong.
For users who currently combine Prime95 for CPU testing and a separate sensor application for monitoring, the consolidation into a single tool is the practical reason to look at this one.
The combined approach to stress and monitoring
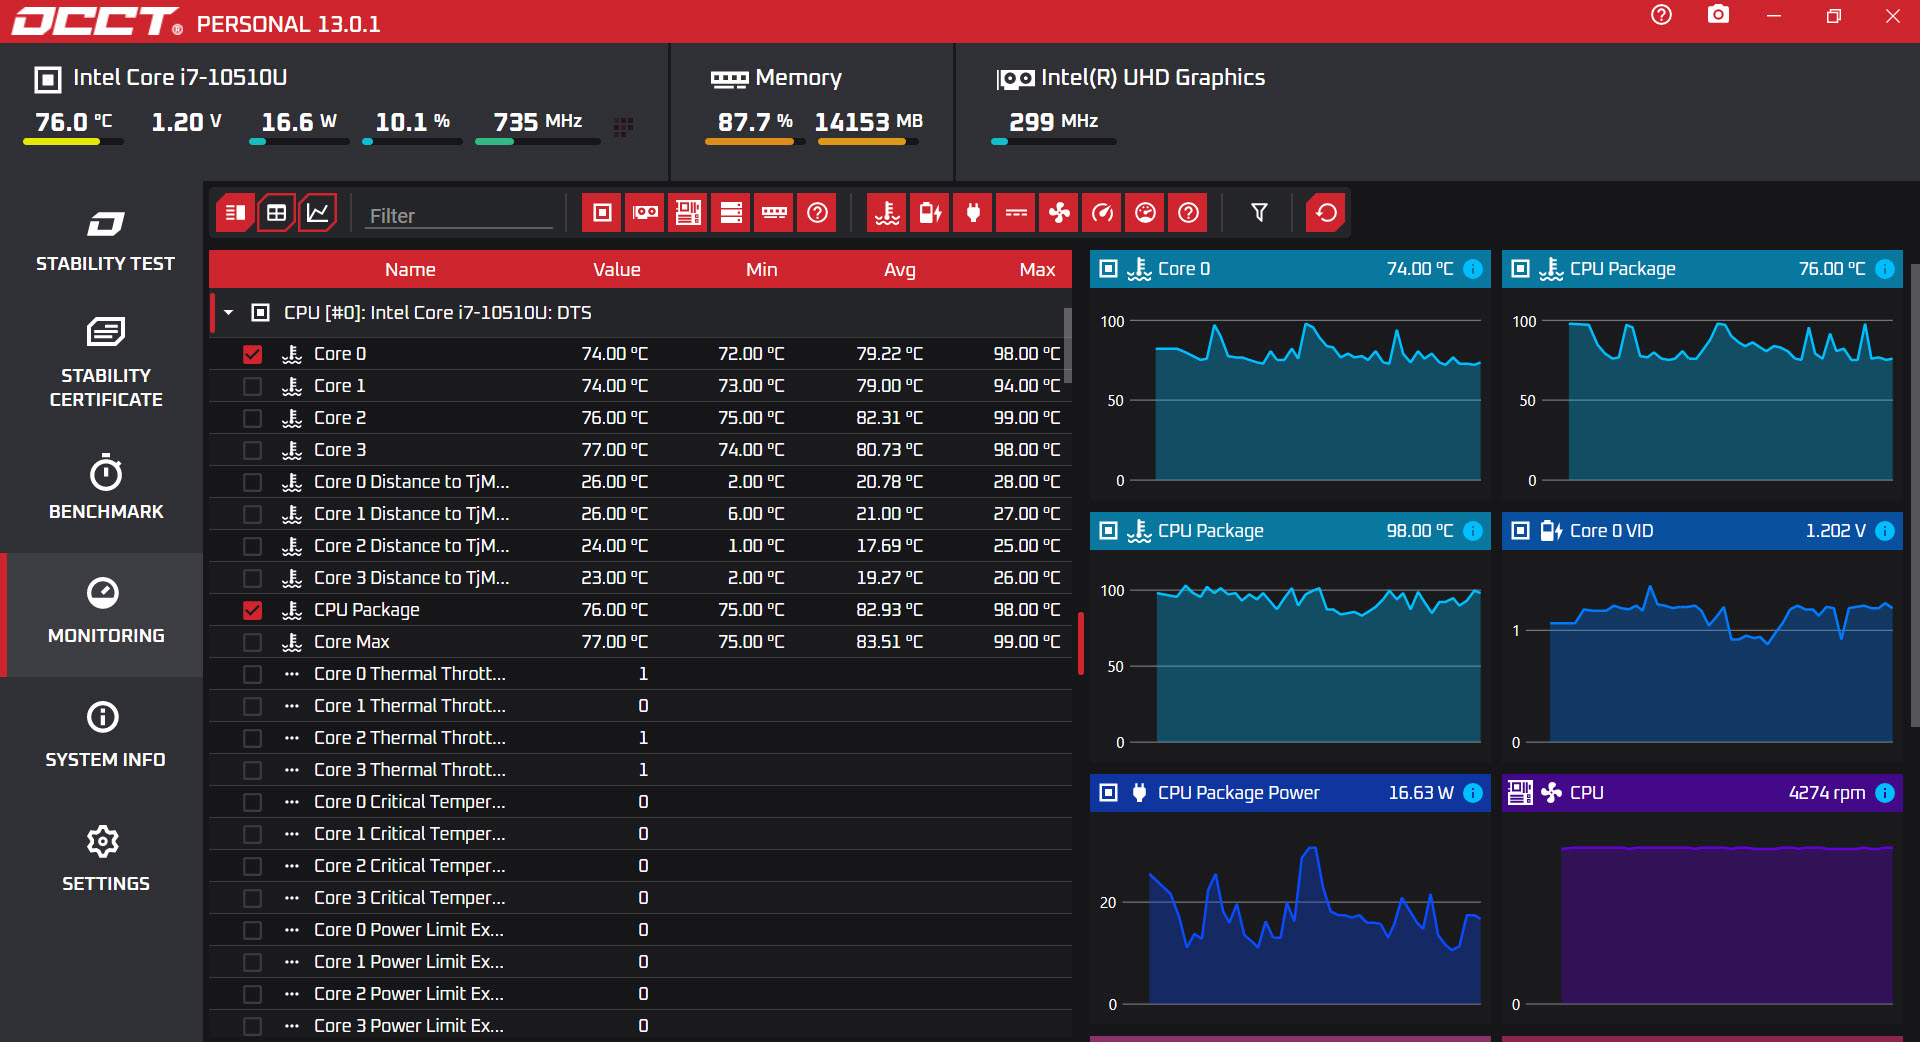
The interface puts the test selection on one side and a real-time sensor view on the other. When a test runs, the sensor panel updates continuously, with per-core CPU temperatures, GPU temperature, power draw, voltage rails, fan speeds, clock frequencies, and memory state all visible at once. After the test ends, the sensor graphs show the entire test duration with markers for when load started and stopped, which is the part that most stress testing tools leave to a separate monitoring application.
Why this matters in practice is that thermal behavior changes over time. A CPU that holds 80°C for the first ten minutes of a stress test might hit 95°C after twenty minutes because case airflow cannot keep up with the sustained load. A GPU that runs at 75°C in normal use might thermal-throttle to lower clocks under extended stress because the cooler is fine for spikes but not for plateaus.
Seeing the full curve of how temperatures evolve during the test is the information you actually want, not just the peak number at the end. The graph view is where this lives, and the integration with the test runner means the data is meaningful in the context of what was happening at each moment.
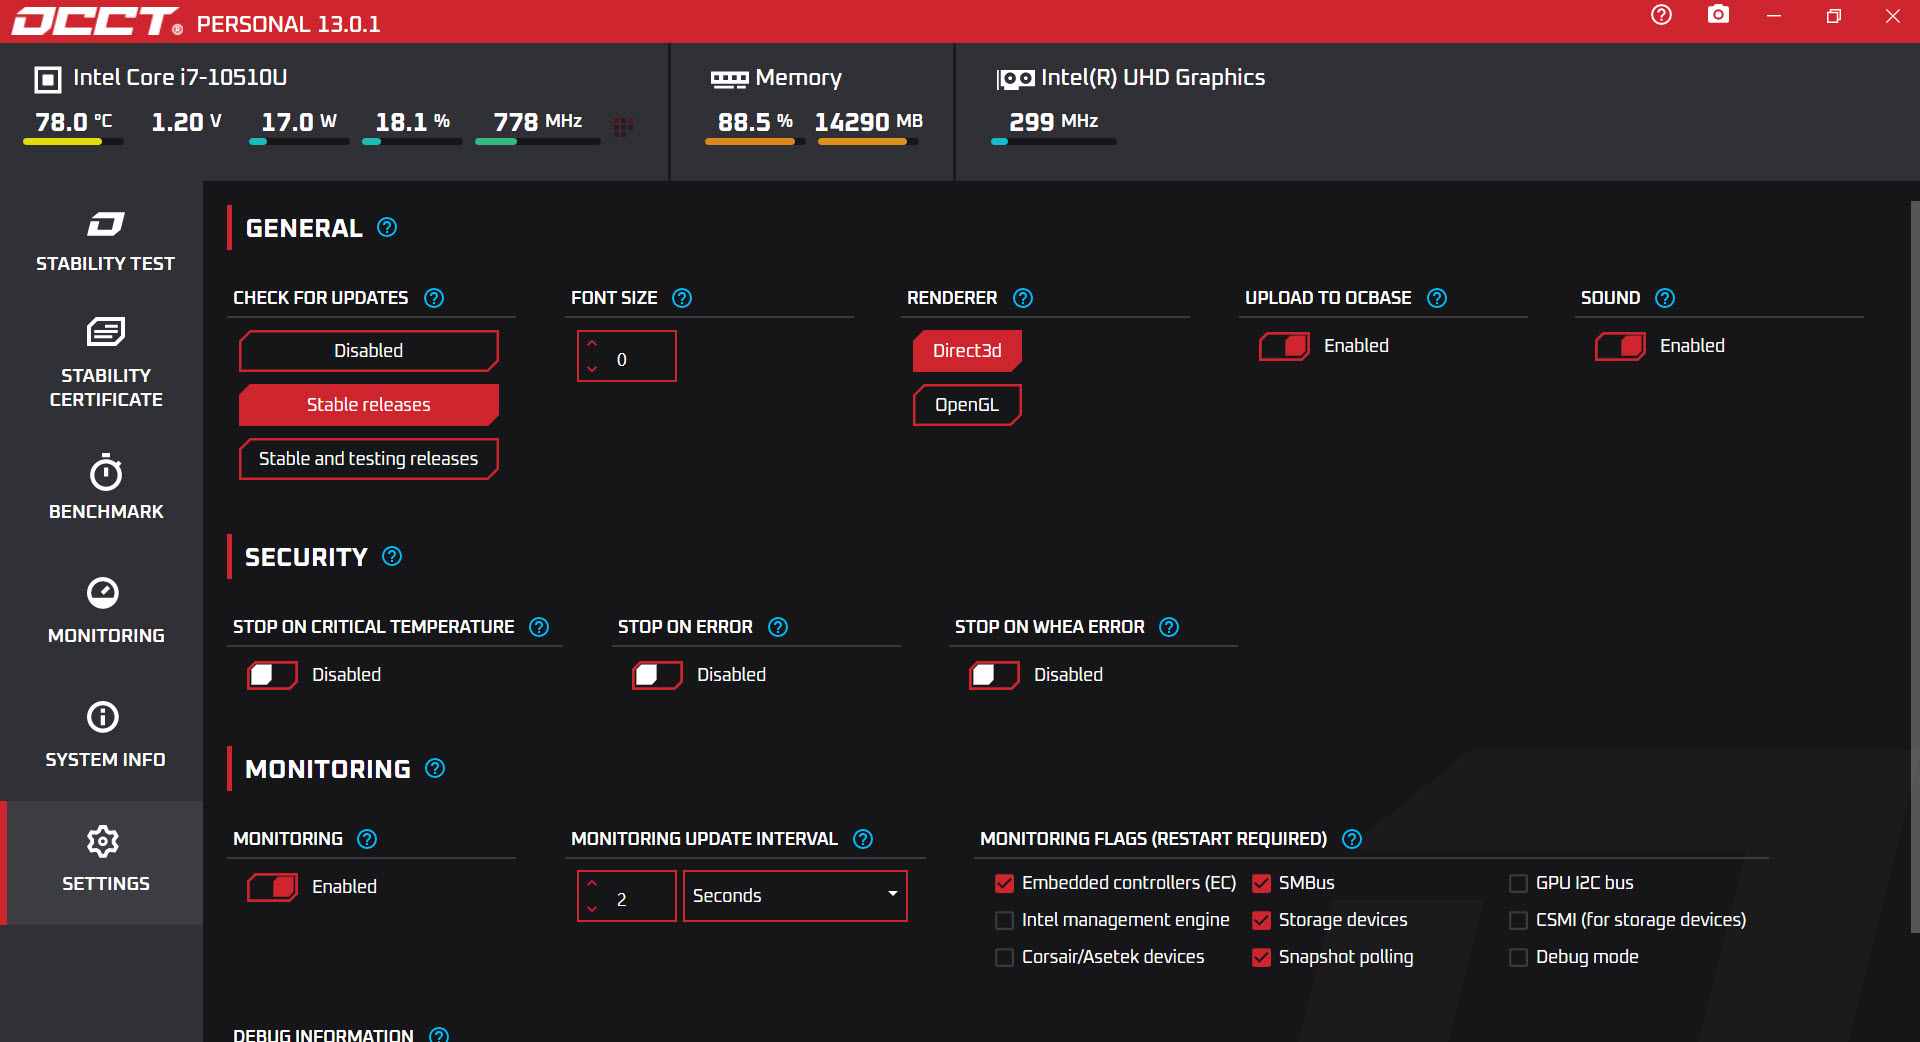
The safety thresholds are configurable per metric. Set a maximum CPU temperature, the application aborts the test if any core crosses it. Set a maximum power draw, same thing. This sounds basic but it changes how comfortable you can be running long tests on hardware you do not want to damage, you set the limits at the point where you would manually intervene anyway, and the application does the intervening for you.
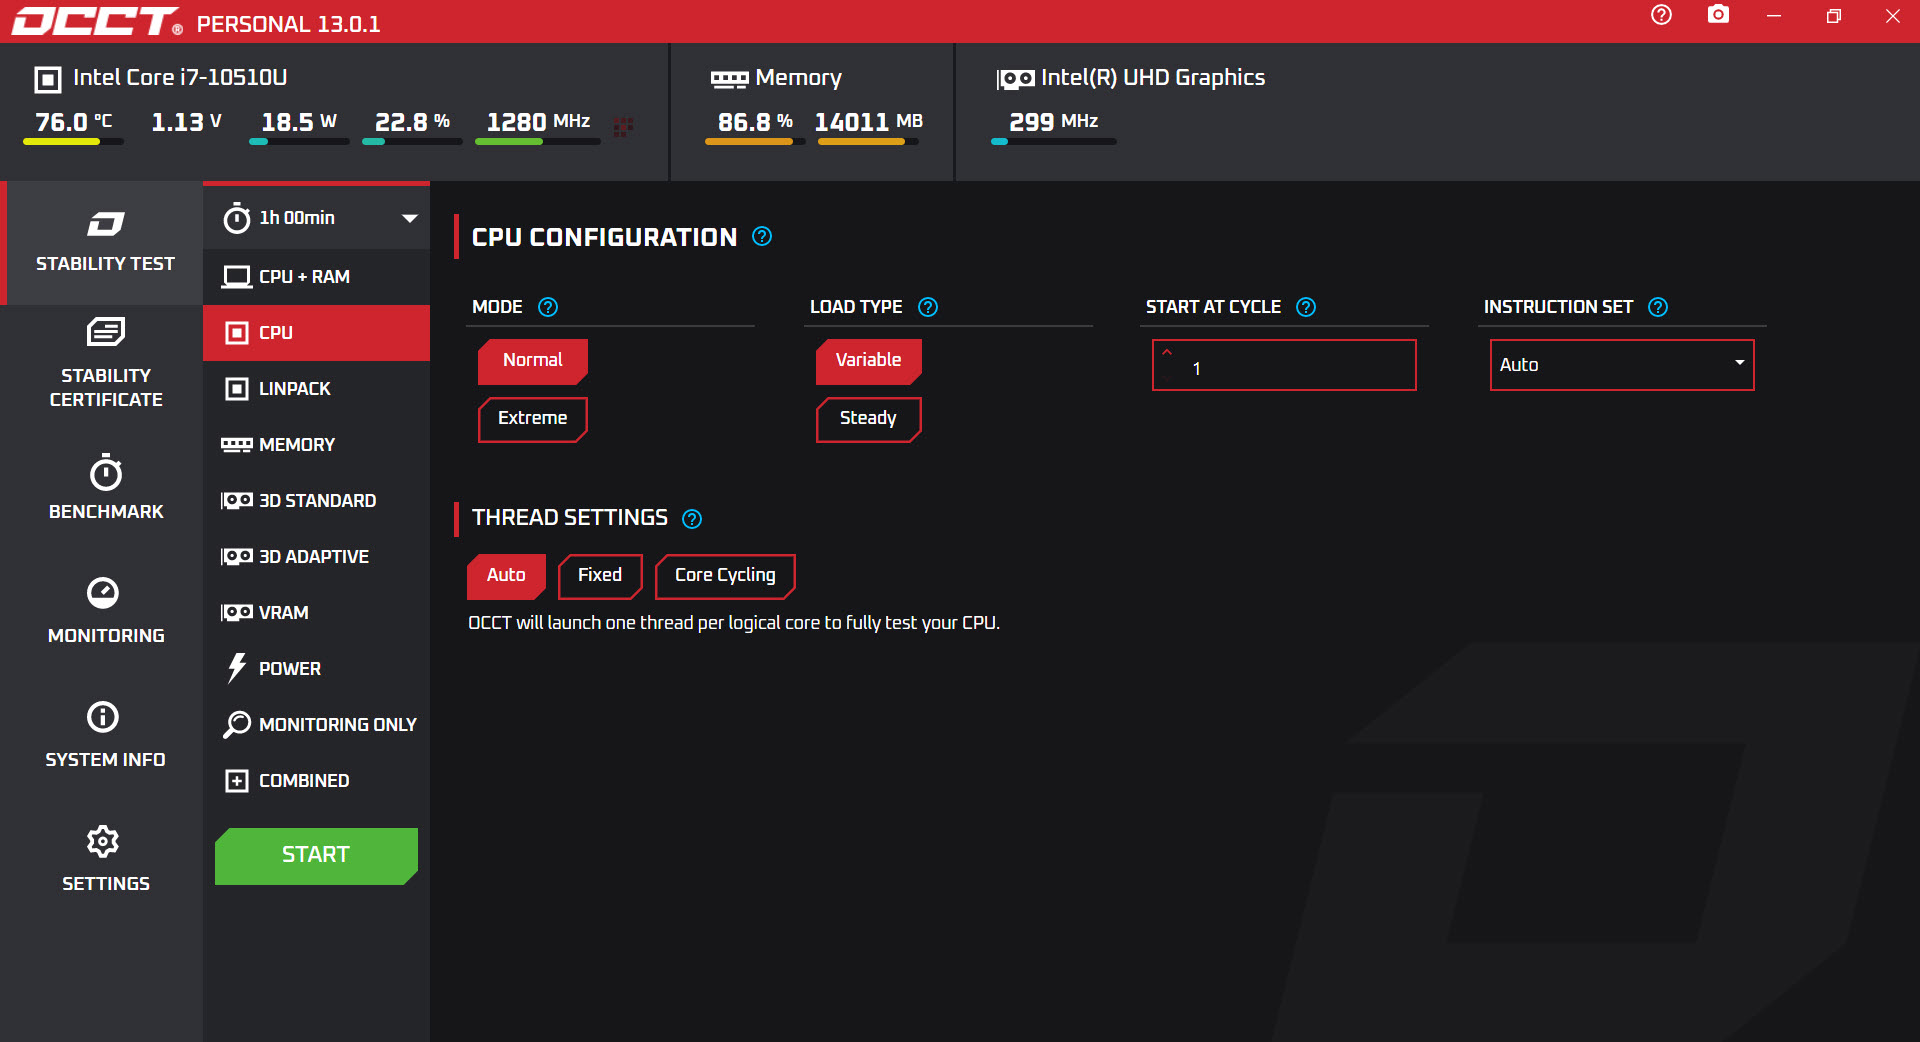
The CPU tests and the instruction set choice
CPU testing offers several test types, each with a different load profile. The Linpack-based test uses optimized linear algebra routines that produce the highest possible computational and thermal load, with selectable instruction sets including SSE, AVX, AVX2, and AVX-512 where the CPU supports them.
The instruction set choice matters more than it sounds, AVX-512 loads draw substantially more power and produce more heat than scalar code, and a CPU that passes an SSE test sometimes fails an AVX-512 test on the same parameters because the wider instructions hit the silicon harder.
There is a separate test that focuses on stability rather than raw thermal load, using a variable workload that mimics real-world software patterns. This is the test that catches certain marginal overclocks that pure Linpack does not, because real software does not look like Linpack and an overclock that survives Linpack can still fail on workloads that mix instruction types in different ratios.
Compared to Prime95’s torture test, which has been the de facto CPU stability standard for years, the OCCT Linpack test produces similar or higher loads with more flexibility on instruction set selection and more integrated sensor data. The two tools both work, the choice between them is mostly about whether you want the integrated monitoring or prefer to assemble your own toolchain.
The GPU and VRAM tests, which include something rare
GPU stress testing covers a 3D load that exercises the shaders, the memory bandwidth, and the rendering pipeline. The visual is a rotating shape or fractal, useful as a sanity check that the GPU is actually rendering rather than that you can see what it is doing. The test can be configured for OpenGL or DirectX backends and for specific resolutions and shader complexity.
What is unusual is the dedicated VRAM test. Most consumer stress tools push the GPU through its rendering pipeline but do not specifically exercise the video memory for errors. The VRAM test in this application writes patterns to GPU memory and reads them back checking for mismatches, the same kind of test that Memtest86+ runs on system RAM but targeted at the dedicated GPU memory. This catches defective video memory, marginal memory overclocks, and failing GDDR cells, none of which a pure shader stress test reliably exposes.
For users who actively overclock their GPU rather than just verify stability, MSI Afterburner handles the overclock side while this application handles the verification side. The two tools complement each other, change a clock or voltage in Afterburner, verify stability with the VRAM test and the 3D test, repeat.
The power supply test, which is the unique trick
This is the test that gives the application its identity. The Power Supply test runs the CPU stress and the GPU stress simultaneously at maximum load, with the explicit goal of pulling as much wattage as the system can possibly draw. The point is to find out whether your power supply actually delivers what it claims under combined load, and whether your voltage rails stay within tolerance when both major heat producers are running flat out.
This matters because PC power consumption is rarely uniform. Most workloads stress either CPU or GPU heavily but not both at the same time. A game might pull 200W from the GPU and 80W from the CPU, a video render might be the inverse, but the combination of both maxed out simultaneously rarely happens in normal use. A power supply that is sized for the peak of either workload alone might struggle when both peak together, producing voltage sag, instability, shutdowns, or, in older or lower-quality units, actual failure.
The combined test exposes this in a controlled way. If the system runs the Power Supply test for an hour without errors or shutdowns, the PSU is genuinely sized correctly. If the system stutters, crashes, or reboots, the answer is in front of you and the next step is either a better PSU or a wattage cap on one of the components.
The sensor monitoring during the test shows exactly what the voltage rails are doing, so a marginal PSU that holds the rails barely within spec is distinguishable from one that holds them comfortably.
The memory test and where it stops short
The memory test stresses system RAM under load conditions, looking for computational errors that indicate marginal memory stability. For RAM that is operating at standard speeds, this is enough to verify basic function. For aggressive memory overclocks, where small voltage and timing changes can produce errors that take hours to surface, the dedicated bootable RAM tests in Memtest86+ remain the deeper choice because they run outside the operating system and can run for many hours of repeated passes without interference.
The application’s in-Windows memory test catches a subset of memory issues quickly, the bootable tools catch issues that need extended runtime to surface. For a quick sanity check on memory, the in-application test works. For verifying a memory overclock you plan to leave in place permanently, running both is reasonable.
The free Personal version and the paid tiers
The application has a Personal tier that is free for non-commercial use, and Pro and Enterprise tiers for paid commercial use. The differences are not in the testing capabilities themselves, the same tests run on all tiers, but in test duration limits, monitoring session length, and licensing for business contexts.
The Personal tier limits how long a single test can run continuously and how long the standalone monitoring mode operates before requiring a restart. For most home users diagnosing a problem, building a new PC, or verifying an overclock, the time limits are well above what a typical diagnostic session needs. For users who want to leave the application running as a permanent system monitor, or who need to run extended overnight tests, the paid tiers remove the restrictions.
The pricing is one-time purchase for Pro, with the option to use the application as a continuous monitoring tool alongside or instead of dedicated sensor utilities. For pure monitoring without stress testing, Core Temp and similar focused tools cover the sensor side at zero cost, the value of the integrated approach in this application is the combination of monitoring with the testing.
How it differs from a benchmark application
This is worth being explicit about because users sometimes conflate the two. A benchmark like 3DMark or Cinebench measures how fast your hardware completes a fixed workload, producing a score you can compare against other systems. A stress test runs the hardware as hard as possible for as long as possible and watches for errors or instability.
Benchmarks tell you whether your hardware is fast. Stress tests tell you whether your hardware is stable. The two questions are different, and the right tool depends on which one you are asking. For overclocking verification, troubleshooting random crashes, or qualifying a new system, the stress test is what you want. For comparing performance against other systems or measuring the improvement from an upgrade, the benchmark is the right tool.
This application is firmly on the stress test side and does not produce comparable benchmark scores.
Conclusion
OCCT is the right tool for users who want a single application that handles stress testing across CPU, GPU, memory, VRAM, and the combined power load, with sensor monitoring tied to the test runs so that thermal and electrical behavior is visible in context. The integrated approach is the practical advantage, instead of starting a stress test in one window and a sensor utility in another and trying to correlate them by timestamp, the application does both at once and produces a single record of what happened.
It is not the right tool for users who just want a fast performance number to brag about, that is what benchmarks are for, and not for users who specifically want bootable memory testing where the dedicated tools remain more thorough.
For the actual job of verifying that hardware is stable under sustained load, with the safety thresholds to make running serious tests less nerve-wracking, the application has built a reputation in the overclocking and PC building community for good reasons.
The free tier covers most home use, the paid tiers exist for users who need extended durations or commercial licensing, and the choice between tiers is straightforward once you know how long you actually plan to leave a test running.
Pros & Cons
- Combined stress testing and sensor monitoring in one application removes the need to run separate tools
- Configurable safety thresholds abort tests before thermal or electrical limits cause damage
- CPU tests support explicit instruction set selection including AVX-512 where the CPU supports it
- Dedicated VRAM test exercises video memory specifically, catching errors a pure shader test would miss
- Power Supply test runs CPU and GPU simultaneously at maximum load, exposing PSU sizing issues
- Sensor graphs show the full test duration, making thermal evolution visible rather than just peak values
- Free Personal tier covers most home diagnostic use cases
- Personal tier limits long test durations and continuous monitoring sessions
- The Linpack CPU test can produce loads higher than realistic worst-case software, some users consider it artificially harsh
- In-Windows memory test does not match the depth of bootable RAM tests for aggressive overclock verification
- Interface presents many options at once, new users may find the array of test types confusing
- Requires careful threshold configuration to avoid either over-aborting tests or under-protecting hardware
- The Power Supply test is intense and can stress old or marginal PSUs to actual failure, which is the point but worth noting
Frequently asked questions
A benchmark measures how fast hardware performs a fixed workload, producing a comparable score. A stress test runs the hardware at maximum load and checks for errors or instability over time. Stress testing answers the question "is this hardware stable" while benchmarking answers "how fast is this hardware." This application is a stress test, not a benchmark.
Most workloads stress either CPU or GPU heavily but rarely both at maximum simultaneously. The Power Supply test runs both at full load to expose PSU sizing problems and voltage rail instability that show up only under combined maximum draw. This is the most aggressive single-system test the application runs, and it is the right tool when you suspect your PSU is the weak link in the chain.
A standard GPU stress test exercises the rendering pipeline, the shaders, and overall GPU activity. The VRAM test specifically writes patterns to video memory and reads them back, checking for bit errors. This catches failing memory cells, marginal memory overclocks, and certain manufacturing defects that the rendering test would not surface because they do not affect frame generation directly.
For basic stability verification, an hour at full load catches most obvious problems. For overclock verification or after a significant hardware change, several hours is more reliable because thermal soak and rare error conditions take time to manifest. For verifying a system you plan to rely on for years, an overnight test approximates the longest stretch of sustained load it is likely to encounter.
The Linpack test produces the highest possible CPU load and is the right choice for thermal validation and finding clear stability limits. The instruction-set selectable tests let you target specific code paths, AVX-512 tests the most demanding case on supported CPUs. The variable workload test is closer to real-world software patterns and catches stability issues that pure Linpack misses. Running both is the thorough approach.
Indirectly, yes, the same as any heavy load tool. Pushing hardware to maximum thermal and electrical limits can accelerate wear on marginal components, and the Power Supply test specifically can stress an old PSU to actual failure. The configurable safety thresholds protect against thermal damage, but the application cannot protect against PSU failure during a test it is specifically designed to push the PSU. Running tests on hardware you cannot afford to lose without backups in place is the basic precaution.
The free Personal tier limits how long a single test can run continuously and how long the standalone monitoring mode operates per session. The actual tests themselves are the same across tiers. Pro and Enterprise add longer durations, commercial use rights, and certain workflow features. For most home users, the Personal tier covers all realistic diagnostic needs.