

Valley Benchmark
About Valley Benchmark
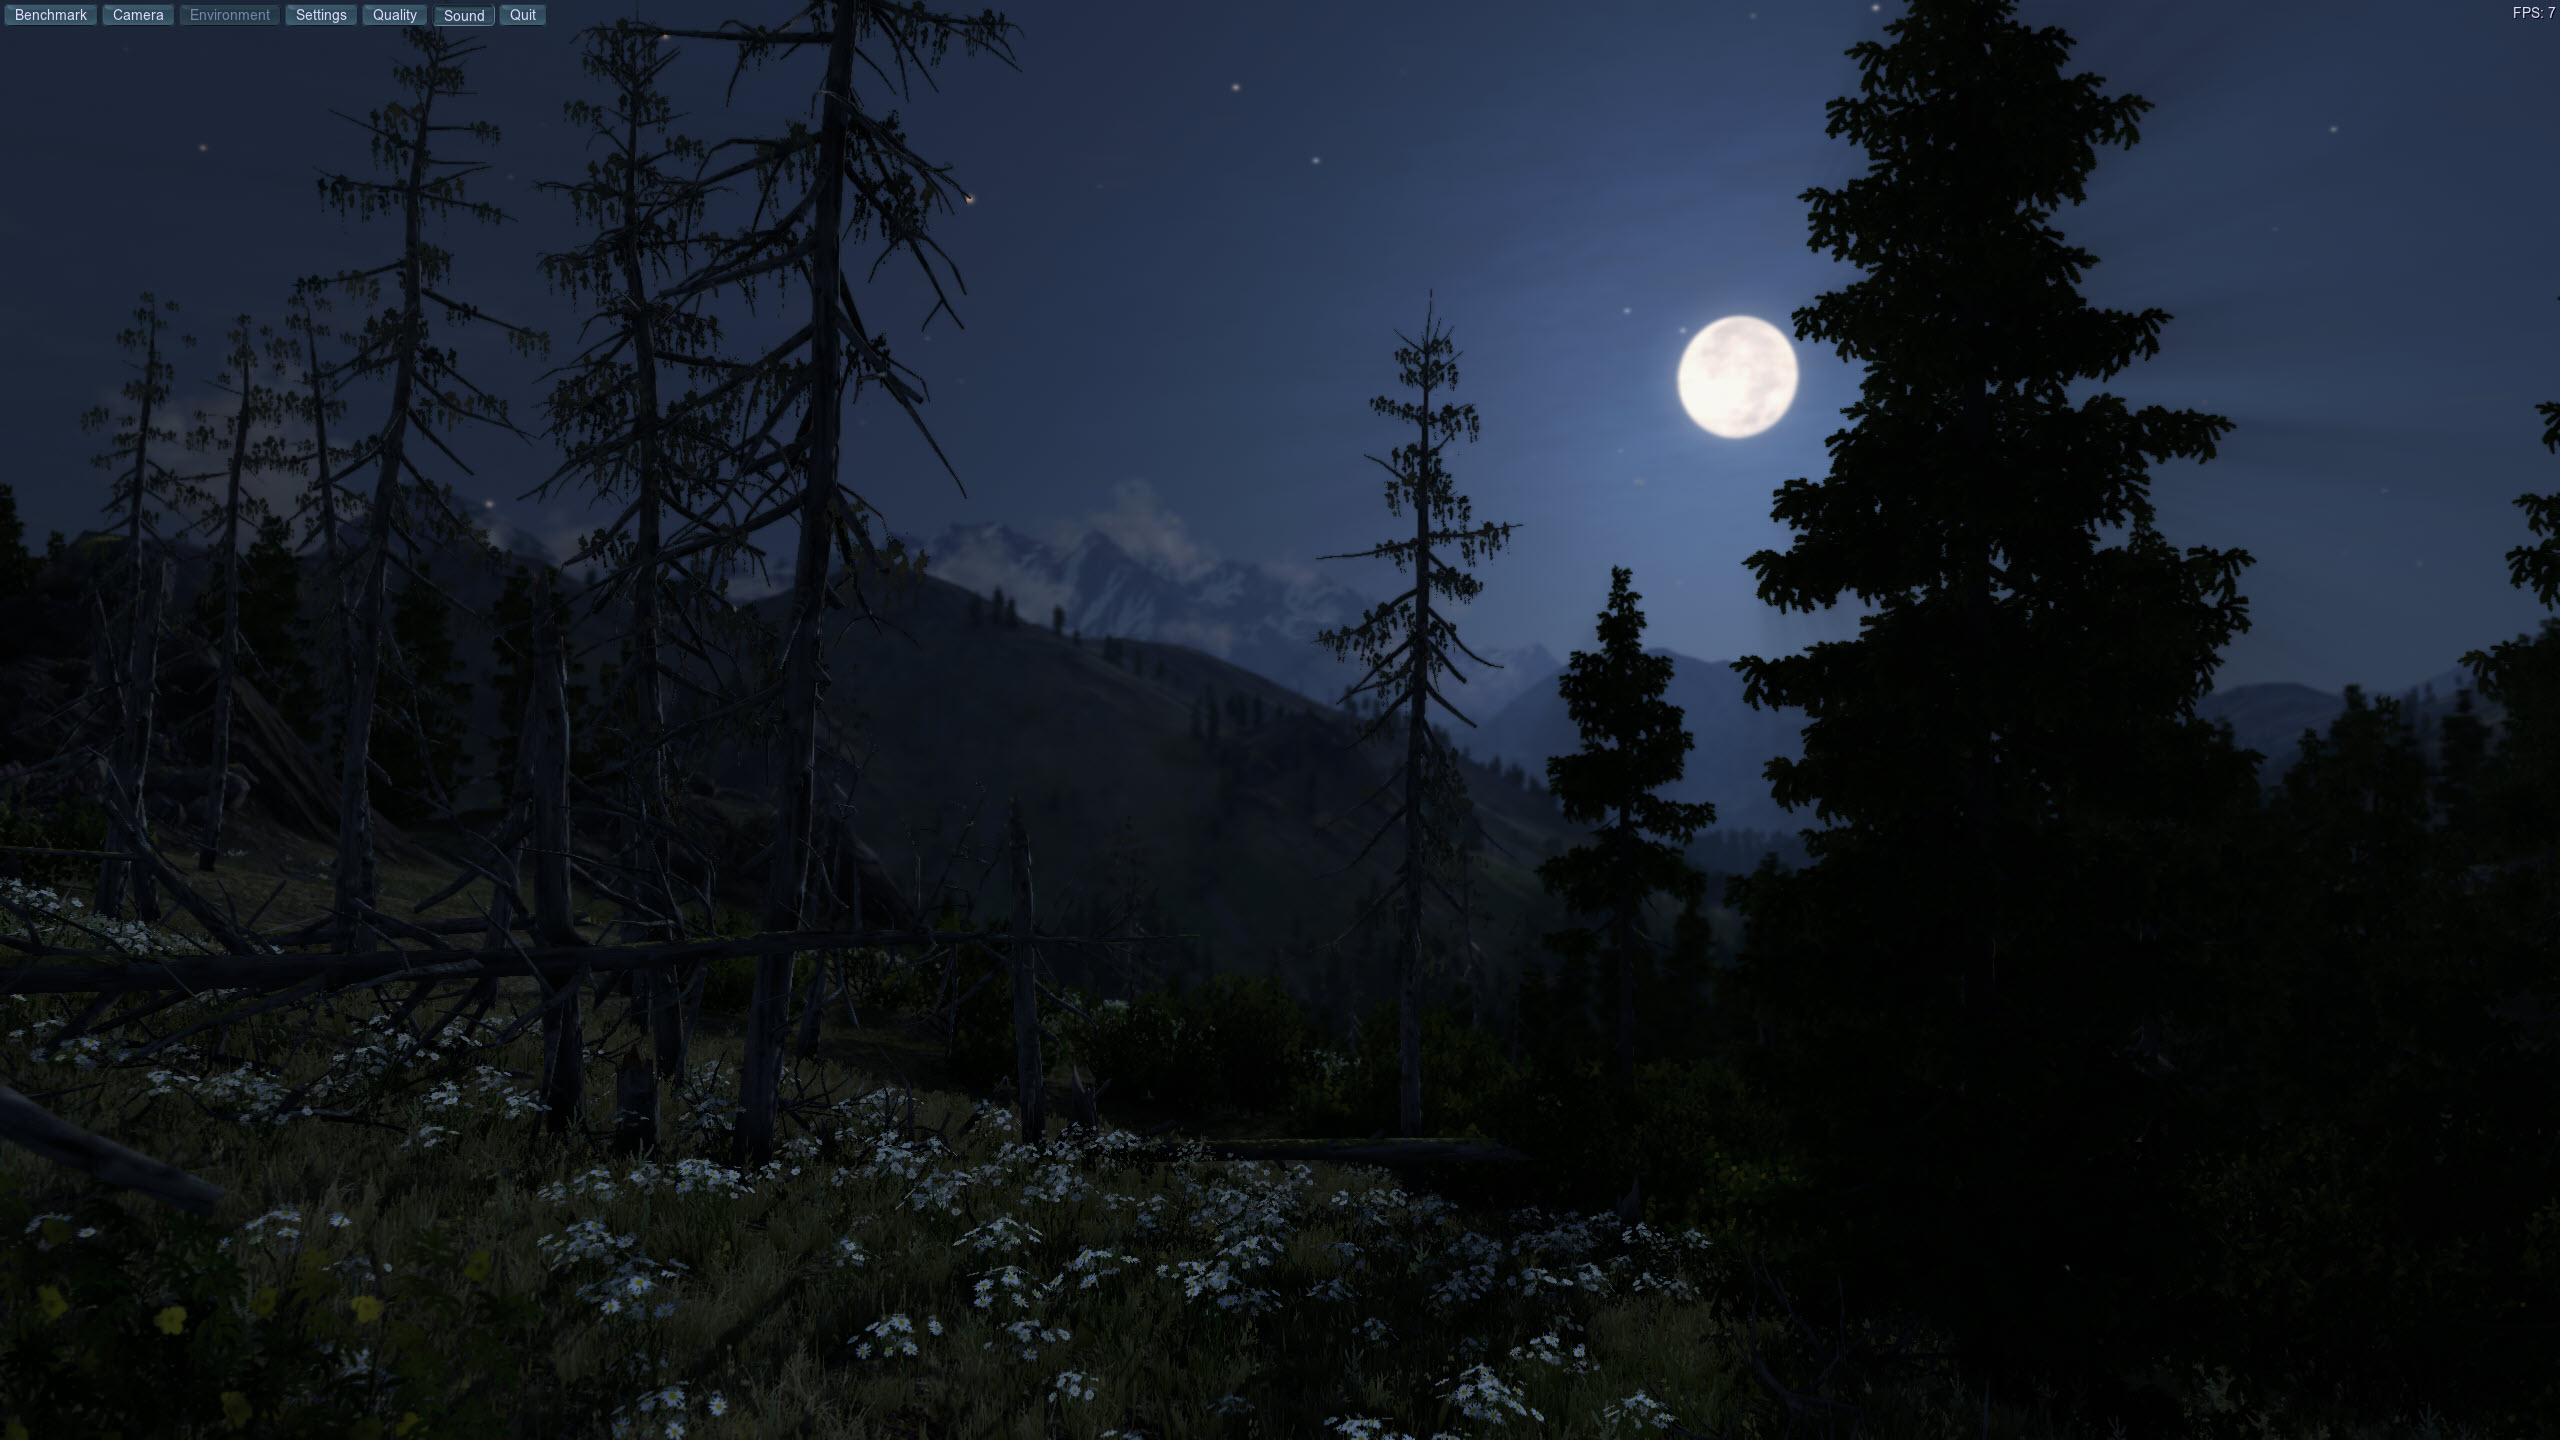
Valley Benchmark tests a graphics card by flying it through a forested mountain valley. Some 64 square kilometres of unbroken terrain, every slope covered in trees, grass and wildflowers, render in real time while the camera glides through a cinematic tour and a counter tracks frames per second.
At the end you get a score, an average frame rate and the minimum and maximum dips, which together describe how the card copes with a heavy, game-like scene.
That game-like quality is the reason to choose it over a synthetic stress test. The load here resembles an open-world title, with long draw distances, dense foliage, dynamic sky and weather, so the numbers it produces track real-world gaming behaviour more closely than a single furry object spinning on screen ever could.
Presets that make scores comparable
The launcher of Valley Benchmark offers three presets plus a custom mode. Basic is a light DirectX 9 run for older or integrated graphics, Extreme raises the detail under DirectX 11, and Extreme HD runs fullscreen at 1080p with maximum quality and anti-aliasing, which is the setting most people mean when they post a score online.
Sticking to a preset matters more than it sounds. A score is only comparable with another score from identical settings, so Extreme HD has become the shared yardstick of countless forum threads and upgrade discussions.
Custom mode, meanwhile, lets you set the API (DirectX 9, DirectX 11 or OpenGL), resolution, quality, anti-aliasing, stereo 3D and multi-monitor output when you are testing something specific rather than comparing.
Reading the score honestly
The result screen reports average, minimum and maximum frame rates alongside the score, and the minimum is the number to respect. An average of 80 frames per second with a minimum of 22 describes a run with real stutter, usually from shader compilation, memory pressure or a processor struggling to feed the card, while a tight gap between minimum and average signals smooth delivery.
Be realistic about what the score represents, though. The engine and the scene are not new, and modern cards breeze through it, so the absolute number says less about top-end performance than a current test would. For comparing recent hardware, 3DMark keeps pace better.
Where this test still earns its place is consistency over time on the same machine, since a score that falls after a driver update or a few dusty months points straight at the culprit.
A valley you can actually explore
Between runs, the camera can be taken off its rails. Free mode lets you fly over the valley from above, walk mode drops you to ground level among the trees, and you can change the time of day, toggle wind and raindrops on the lens, and adjust depth of field. Screenshots go to a folder with a single key.
This is less frivolous than it seems. Walking a heavy scene at your own pace is a handy way to spot rendering glitches, flickering textures or the odd shimmering pixel, which are early signs of an unstable overclock or failing memory, without staring at a scripted flyby you have already seen forty times.
As a stability check
Running the flyby repeatedly turns Valley Benchmark into a credible stability test for an overclock, because the varied load swings power draw and clock speeds the way games do rather than pinning them flat. A card that survives several full passes without artifacts or a driver reset is in reasonable shape for daily gaming.
This edition does not loop the benchmark by itself, so long sessions mean restarting runs or simply leaving the cinematic tour playing. For a quick, harsh test of cooling, a dedicated GPU burner heats a card faster.
Pair either with MSI Afterburner to log temperatures and clocks during the run, since the overlay here shows frame rate and basic card information but not the sensor detail that explains a throttling dip.
Conclusion
Valley Benchmark suits gamers and tinkerers who want a repeatable, game-like measurement of their graphics card and a shared scoreboard to compare against. It answers the practical questions well, whether a driver update helped, whether an overclock holds through varied load, whether the machine stutters where it should not.
It is no longer the toughest test around, and owners of the newest cards will find it undemanding. For tracking a system over time and catching instability in a scene that behaves like a real game, it remains a useful and pleasant tool to keep handy.
Pros & Cons
- Open-world scene loads a card much like a real game would
- Extreme HD preset gives scores that are easy to compare with other owners
- Minimum and maximum frame rates reveal stutter that an average hides
- DirectX 9, DirectX 11 and OpenGL rendering paths in one tool
- Free and walk camera modes help spot visual artifacts at your own pace
- Modern cards find the scene light, so absolute scores say little about new hardware
- Looping stress mode is reserved for higher editions
- No detailed temperature or power monitoring during the run
Frequently asked questions
Extreme HD, if you want to compare your score with others. It runs fullscreen at 1080p with maximum quality and anti-aliasing, and that is the setting most published results use.
Yes, by running the flyby several times and watching for artifacts, crashes or driver resets. Because the load varies like a real game, it complements harsher tests that pin the card at full power.
Brief dips usually come from shader compilation on the first run, a processor bottleneck, or the card running out of video memory at high settings. Run the test a second time, and if the minimum stays low, check temperatures and memory use with a monitoring tool.


