

SimplexNumerica
About SimplexNumerica
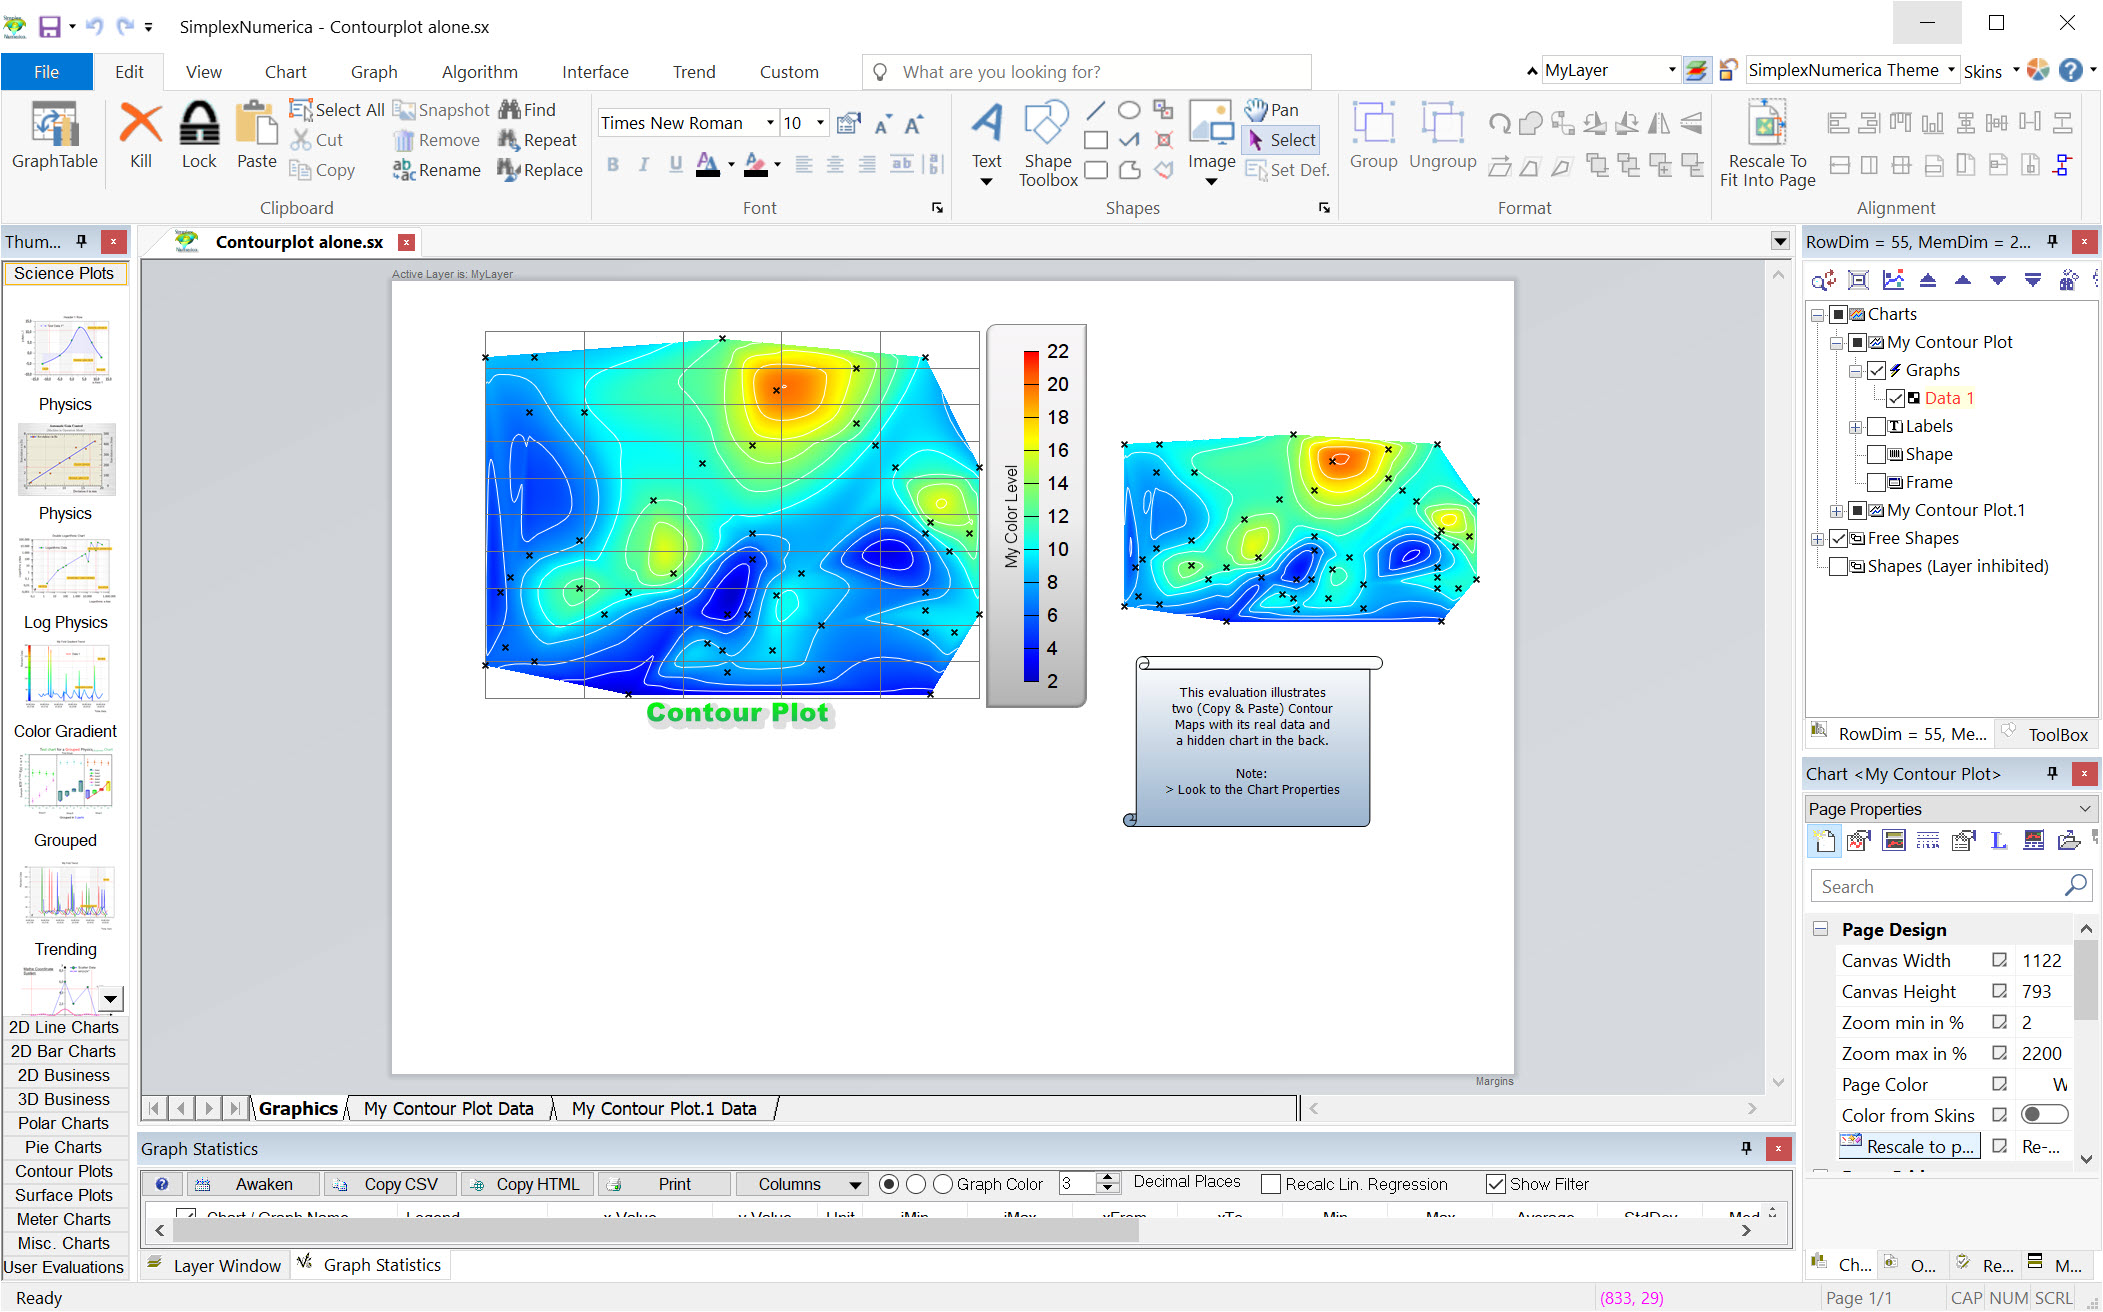
A spreadsheet will draw a chart from a column of numbers, and anybody who has tried to put that chart into a report knows where it stops. SimplexNumerica is built for the other end of that job, turning measurement data into diagrams intended for publication and running the analysis that belongs alongside them.
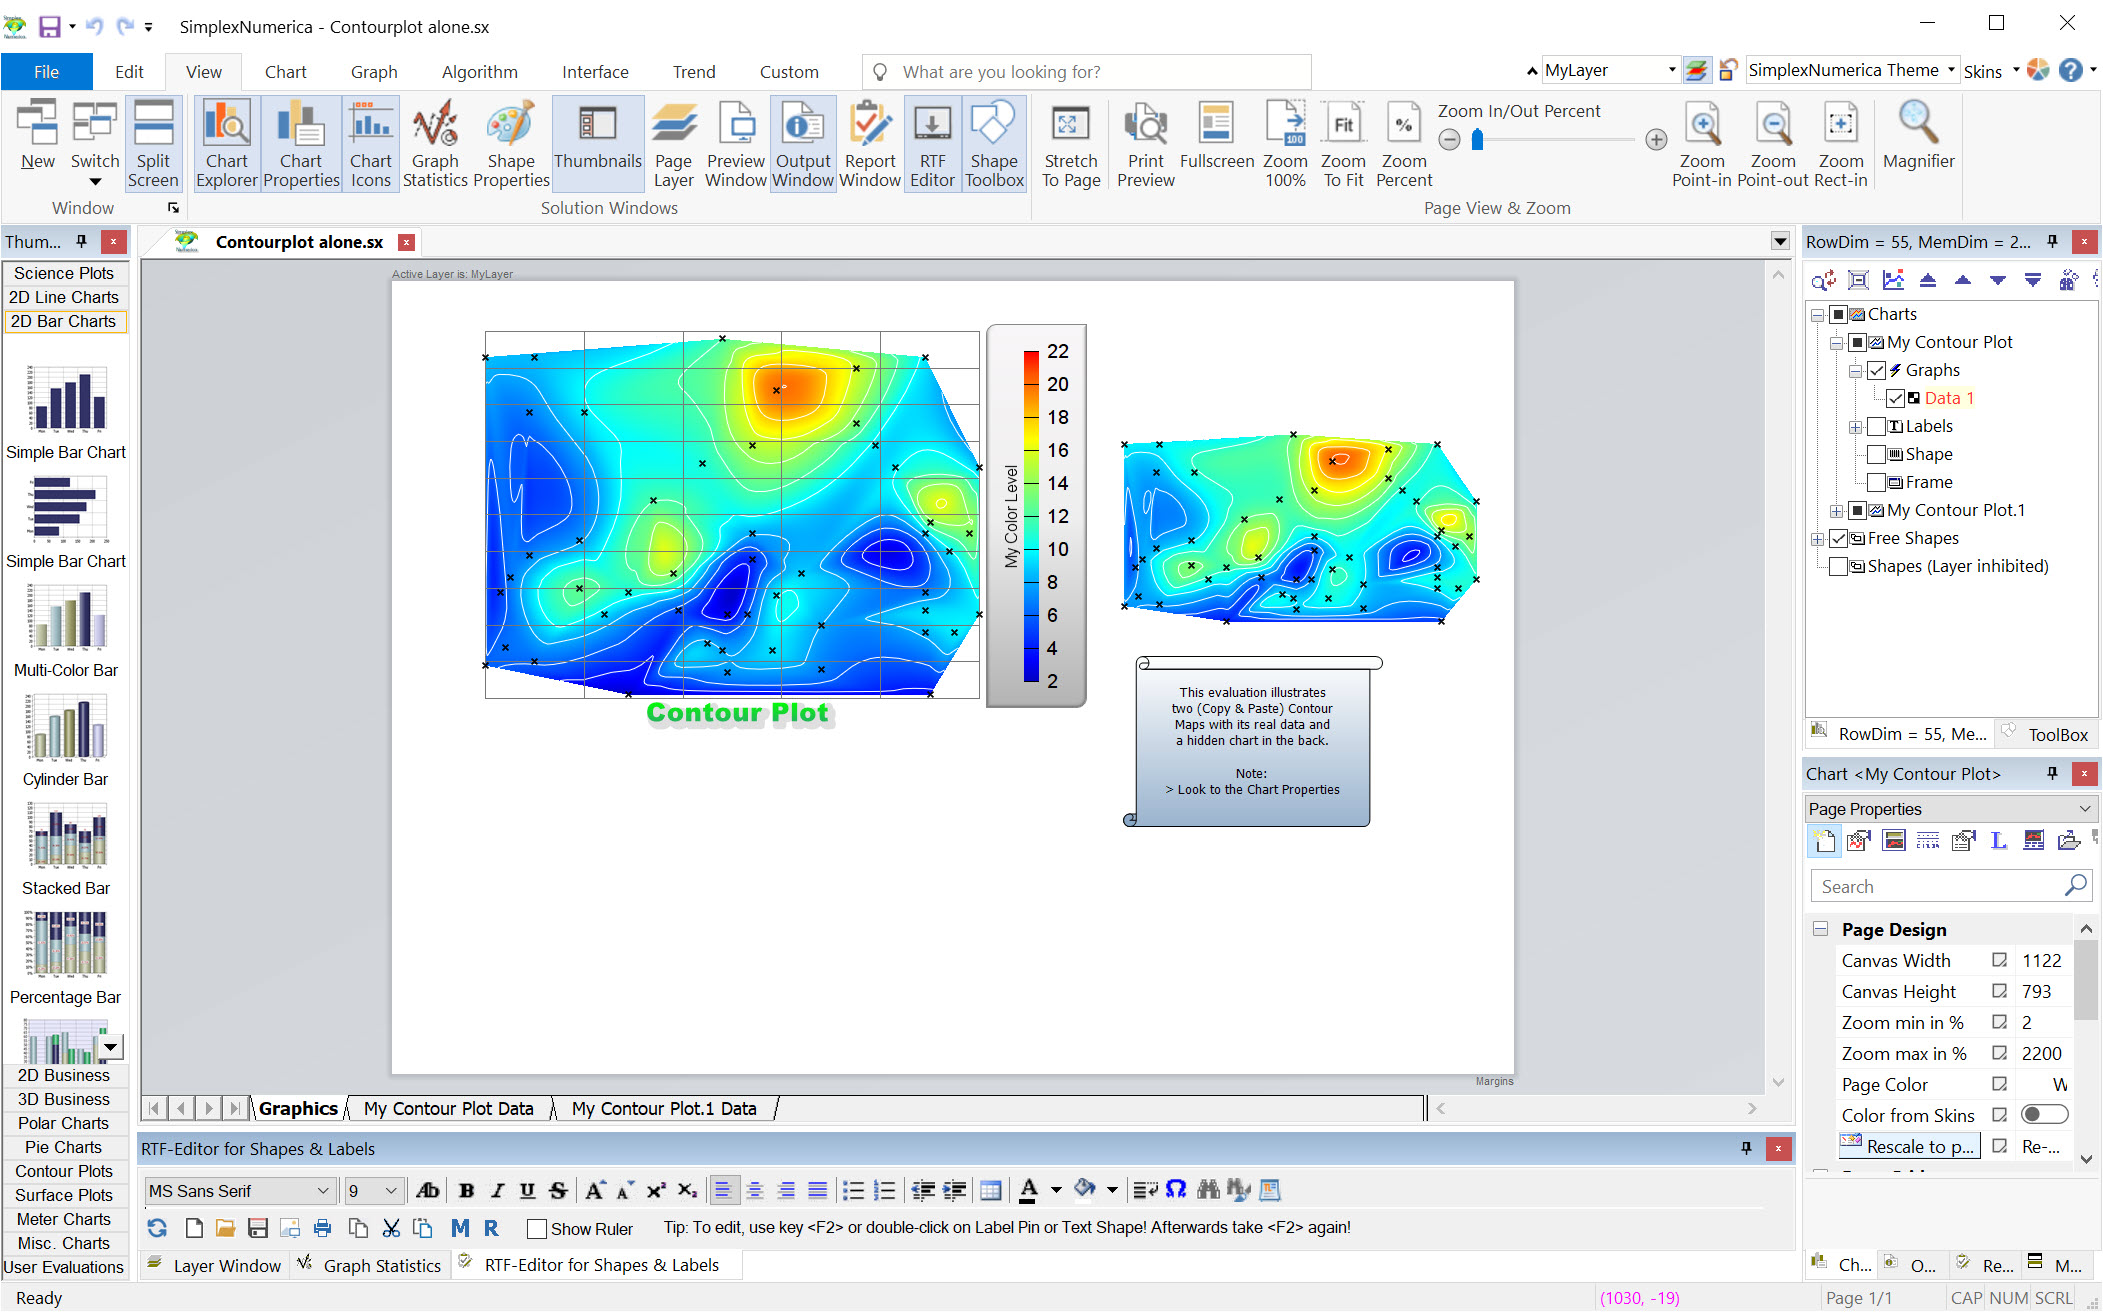
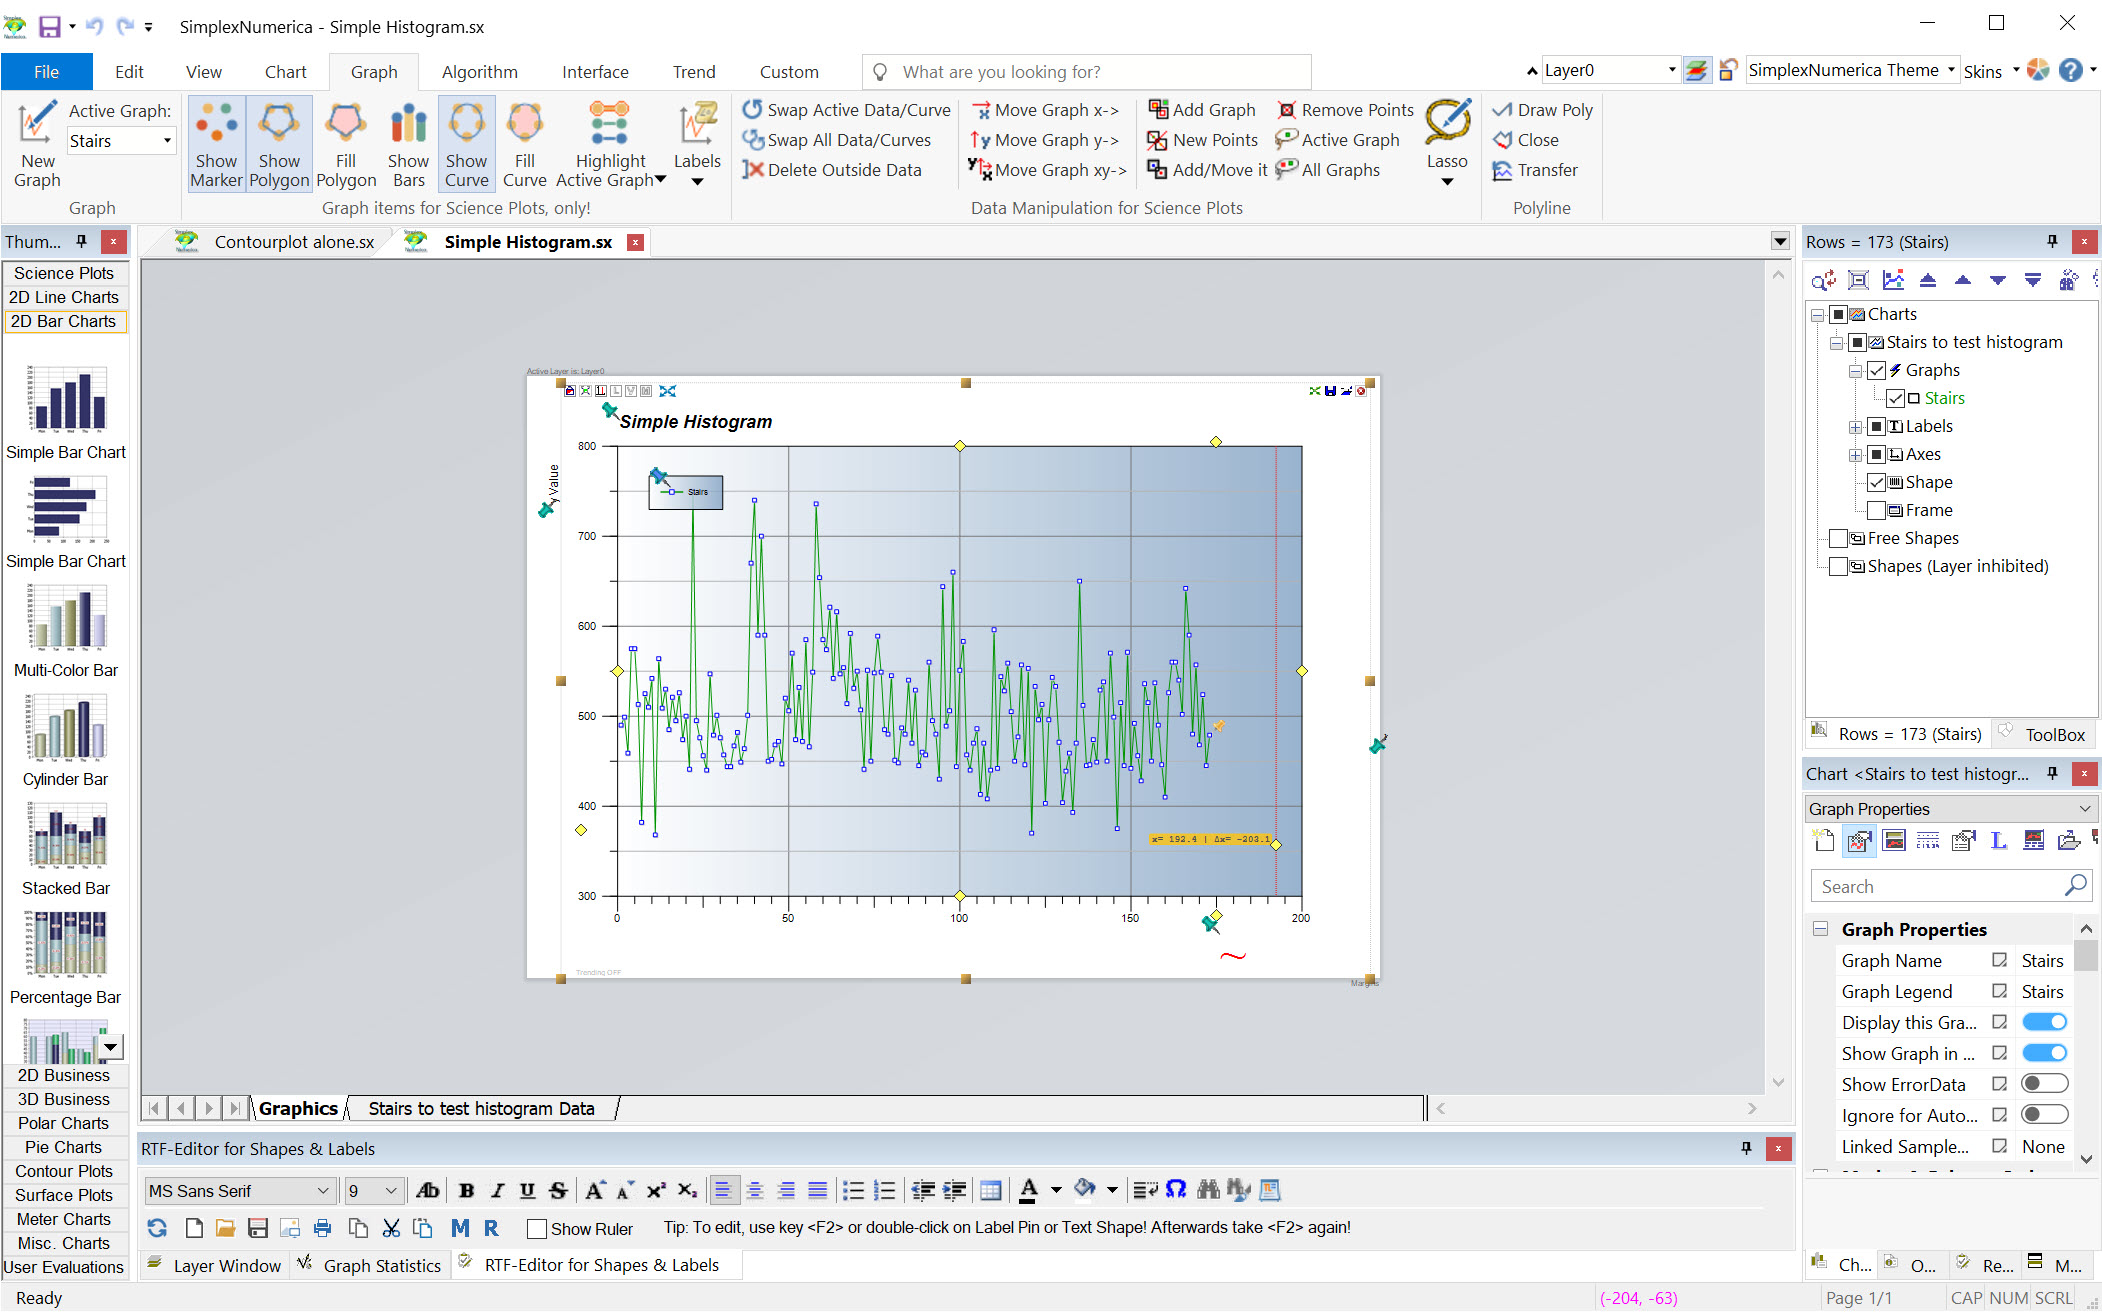
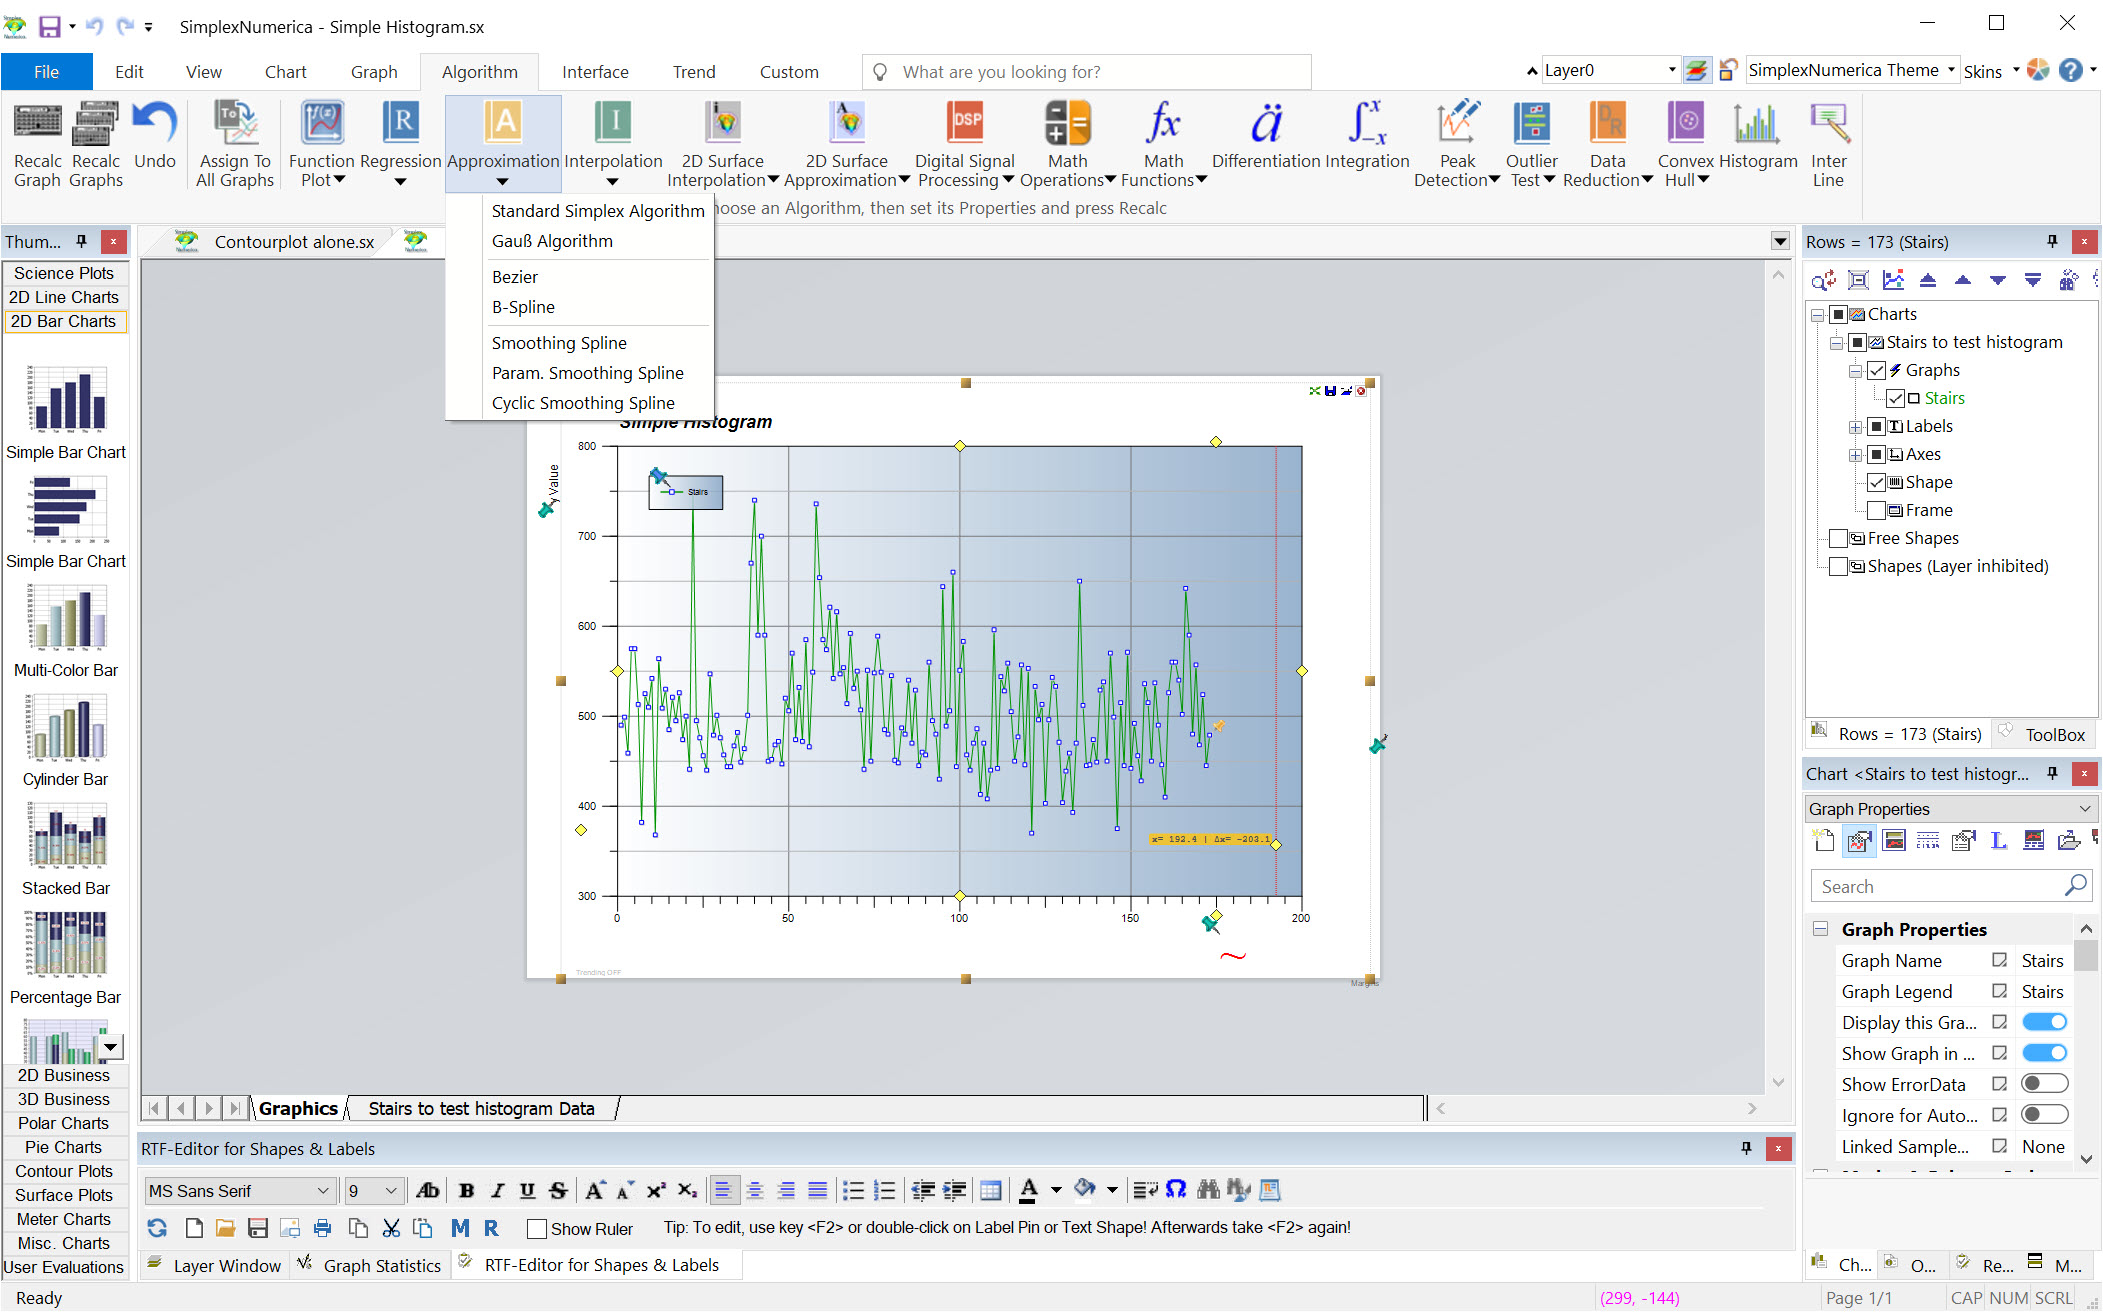
SimplexNumerica follows the familiar office interface arrangement, with toolbars and ribbons, so the first hour is not spent working out where anything is.
What sits behind it is considerably deeper than the appearance suggests, and one detail about the free version decides whether it is any use to you.
The free version limits the charts, not the functions
Here is the SimplexNumerica point nobody states clearly, and getting it wrong wastes an evening.
Every function is available without paying. The analysis, the fitting, the transforms and the data handling all work.
What is restricted is the chart types. The free version draws a limited set, meaning the standard coordinate diagrams and mathematical charts, and the rest of the library sits behind payment. A banner is displayed as well.
That is an unusual way to divide a product and it has a specific consequence. Somebody who needs a contour plot, a surface, or one of the statistical chart types will find the analysis works perfectly and the output they came for is unavailable.
So the sensible first step is establishing which chart you actually need, and only then finding out whether it is included.
The analysis is the real content
The SimplexNumerica chart library gets the attention, and the algorithms are where the substance lies.
Curve fitting covers the approaches people actually use, meaning regression, interpolation, approximation and splines, so a set of measured points becomes a described relationship rather than a scatter of dots.
Frequency analysis is present, which matters for anybody working with signals or vibration, along with filtering to remove what the measurement picked up and you did not want.
Outlier detection deserves its own mention, since deciding which points to discard is the part of data analysis where honest people disagree, and having the tool propose them explicitly is better than quietly dropping them.
Data arrives from spreadsheets directly, which is how most measurement data reaches a computer in the first place, and a scripting facility handles the cases where the built-in operations are not quite what you need.
The arranging and cleaning that precedes any of it belongs elsewhere, and a spreadsheet for sorting the columns out first is where that work happens.
Publication is the target, and that shows
The stated SimplexNumerica purpose is diagrams for papers and reports rather than charts for a screen, and the difference is real.
A chart destined for print needs control over every element, meaning axis scaling and labelling, tick placement, fonts, line weights and how the whole thing behaves when it is scaled to fit a column.
That control is here in the quantity such work requires, which is also why the dialogs are dense. Somebody wanting a quick picture will find it heavy, and somebody who has fought a spreadsheet into producing an acceptable figure will recognise what they are being given.
Where it sits
Being honest about the SimplexNumerica position, since this is a small program in a field of large ones.
The commercial packages that dominate scientific plotting cost a great deal and do more. The free alternatives are capable and generally ask you to describe the plot in a language rather than build it in a window.
This occupies the space between, offering a conventional interface, real analysis and publication output, with the chart restriction as the condition attached.
For data that comes out of a simulation rather than an instrument, LTspice produces its own waveforms and exports them for exactly this kind of treatment.
Conclusion
SimplexNumerica is aimed at a specific person, meaning somebody with measured data and a figure to produce for something that will be printed. The fitting and analysis are genuine, the control over the diagram is what that work needs, and the interface does not demand learning a language first.
Check the chart restriction before investing any time. Every function works without paying and the diagram types are what the free version limits, so establish that the chart you need is one you can actually draw. Get that right and it does a job spreadsheets have never done well.
Pros & Cons
- Every analysis function available without paying
- Curve fitting, interpolation, splines and regression in one place
- Frequency analysis, filtering and explicit outlier detection
- Control over chart elements at the level publication requires
- Familiar interface arrangement, so orientation is quick
- Imports spreadsheet data directly, plus a scripting facility
- The free version restricts which chart types you can draw
- A banner is displayed in the free version
- Dense dialogs, since publication control means many options
- Smaller than the commercial packages that dominate this field
- More program than anybody wanting a quick chart needs
Frequently asked questions
The chart types rather than the functions. Analysis, fitting and data handling all work, and only a limited set of diagrams can be drawn, with the rest of the library behind payment. A banner appears as well.
Yes, and that is its stronger half. Regression, interpolation, approximation and splines are included, along with frequency analysis, filtering and outlier detection.
Because a spreadsheet gives you a picture and this gives you control over every element of it, which is what a figure destined for print requires. The fitting is also considerably beyond what a spreadsheet offers.
Spreadsheets import directly, which covers most measurement data, and a scripting facility handles anything the built-in operations do not.


