Mem Reduct


 (34 votes, average: 3.94 out of 5)
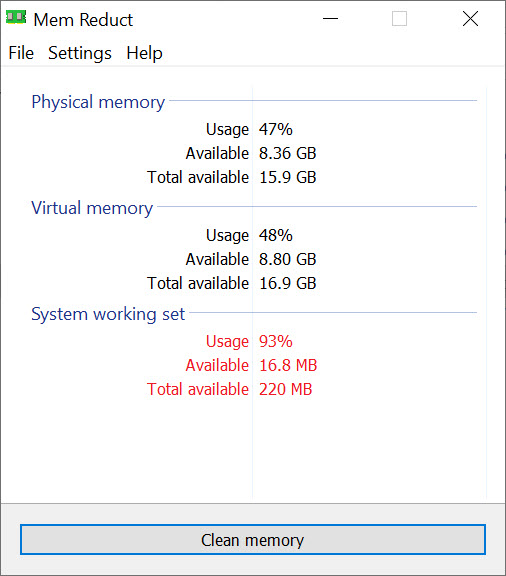
About Mem Reduct
The Windows memory model is misunderstood by users who see “RAM in use” and think empty RAM is good RAM. Mem Reduct is built around the opposite philosophy. It uses undocumented Windows Native API calls to forcibly empty specific memory regions that Windows would otherwise keep populated, freeing somewhere between 10 and 50 percent of total RAM depending on what was cached at the time of the clean. Whether this is useful or counterproductive is a more interesting question than the tool’s marketing acknowledges, and we will get to it.
At 382 KB, this is one of the smallest utilities of its category on the platform. It sits in the system tray as a colored icon (green under 70 percent memory usage, orange between 70 and 90, red above 90), updates every second, and offers a single-click clean from the right-click menu.
The source code is on GitHub under GPL-3.0, the release binaries are GPG-signed, and the project has been maintained since 2017 with regular updates.
What the application actually cleans
Most memory cleaners trim process working sets and stop there. Mem Reduct targets eight distinct regions, and understanding what each one is helps explain why the freed-RAM numbers can be large and why some of them are misleading.
The working set of each process is the physical RAM currently mapped to that process. Trimming it asks Windows to swap less-used pages out to the pagefile so they no longer count as resident memory. The system file cache holds recently accessed file contents for fast re-reads. The standby lists hold pages that were recently used but are now available, sorted by priority from 0 (lowest) to 7 (highest), used for SuperFetch and similar prefetch features. The modified page list holds pages that have been changed and are pending write to disk. The combined memory list holds deduplicated identical pages across processes. The registry cache holds recently accessed registry hive data. The modified file cache, added in version 3.5, handles a related buffer for file system writes.
Each of these gets cleared independently. You can run “Clean memory” to hit all eight, or open the dropdown and target one specific region. This granularity is the main thing that separates the tool from one-click cleaners like CleanMem and from Microsoft’s own RAMMap, which has the same underlying capability but a more diagnostic interface.
The standby list problem nobody mentions
Here is the thing most reviews skip. The standby list is not “wasted” memory. It is RAM that Windows is deliberately keeping populated with recently used data because reading from RAM is several orders of magnitude faster than reading from disk. When the system needs more memory for an active task, Windows discards standby pages automatically and instantly. There is no performance benefit to clearing the standby list preemptively, because the data was already free for the taking.
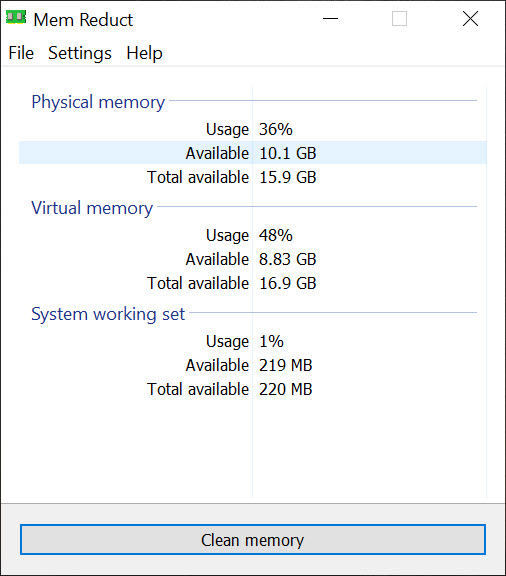
When you clear the standby list with Mem Reduct, the immediate effect is that your “available memory” number goes up. The actual effect is that any application or file you used recently now has to be re-read from disk the next time you switch to it. On a system with an NVMe SSD this is fast and you may not notice. On a system with a mechanical hard drive, the next few minutes after a clean can feel noticeably more sluggish than before.
This is not the tool’s fault. It does exactly what it claims to do. The question is whether you should want it done, and the honest answer is, usually no, sometimes yes. The “sometimes” is where the tool genuinely helps.
When clearing memory actually helps
There are two scenarios where forcing cached memory to release is legitimately useful.
The first is right before launching a memory-intensive application. If you are about to start a game that needs 12 GB and you currently have 14 GB of standby cache from photo editing earlier, the game launch will be slower because Windows has to evict cache while also loading the game. Pre-clearing the cache gets the eviction over with first, which can smooth the launch. Gaming forums where this tool gets recommended are mostly responding to this specific situation.
The second is memory leaks in long-running applications. Some programs do not release memory cleanly when you close them, leaving working set pages allocated until the next reboot. Trimming working sets forces Windows to reclaim that orphaned memory. For users running heavy resource monitoring sessions or development workflows that involve crashy debuggers, periodic cleans can extend uptime between reboots.
Outside these cases, automatic periodic cleaning is solving a problem that mostly does not exist on modern Windows. The OS does this work itself, more intelligently than a fixed-interval timer can.
Auto-clean modes and configuration
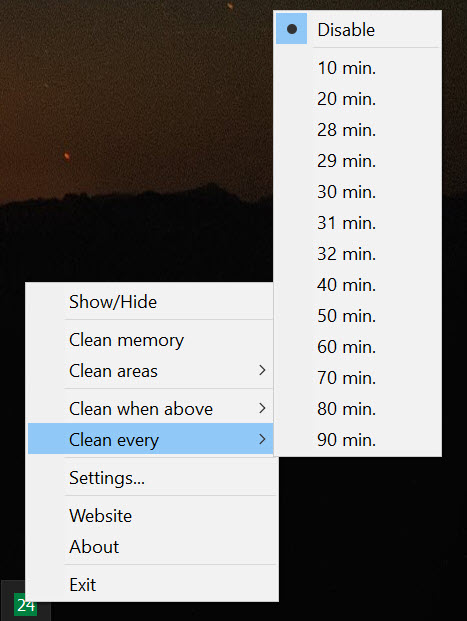
The application supports two automatic triggers. Interval-based runs a clean every N minutes (configurable from 10 to 90). Threshold-based watches the memory usage indicator and triggers a clean when it crosses a percentage you set (the default is around 80 percent, but you can pick any value).
Threshold-based is the more defensible mode of the two. If your system genuinely runs out of free memory and starts swapping, a clean can stop the swap activity earlier than Windows would have on its own. Interval-based is harder to justify, because most of the time the trigger fires when no actual memory pressure exists, and you are just churning the cache for no benefit.
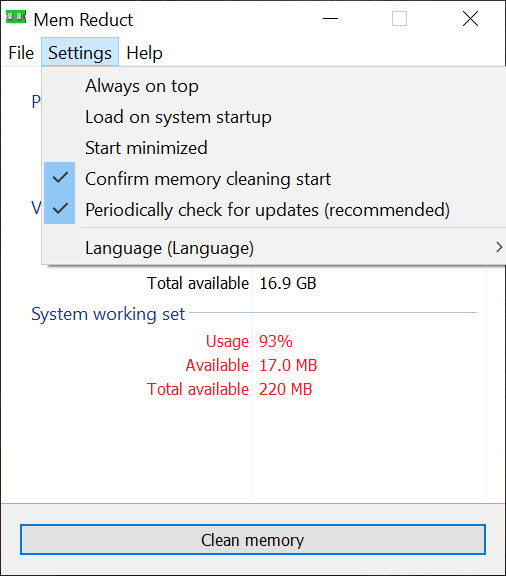
You can also set keyboard shortcuts for clean operations, configure notifications to fire when memory usage crosses thresholds (without auto-cleaning), and exclude specific memory regions from being touched. The last option matters. If you experiment with the tool, configure it to skip the standby list specifically and only trim working sets. That is the safest configuration and captures most of the legitimate use case.
Portable mode and INI configuration
Drop a file named memreduct.ini next to the executable and the application reads and writes all settings to that file instead of the Windows registry. The portable installation runs without administrator privileges for the basic memory monitoring, although certain cleans (priority-0 standby list, registry cache) require elevation to perform. You can keep the executable on a USB drive and use it across multiple machines without leaving traces.
The CLI interface, added in version 3.4, exposes every clean operation as a command-line argument. memreduct.exe /clean runs all cleans. Individual regions can be targeted with specific flags. This makes the tool usable in batch scripts or Task Scheduler jobs, although the same caveats about whether you should do this automatically still apply.
The dark theme and interface refinements
A full dark theme is available alongside the default light interface. The interface is utilitarian by design (this is a single-purpose tool, not a dashboard), with the main window showing three real-time memory metrics. Physical memory, virtual memory, and system working set. Each one shows current usage, available capacity, and total size. Right-clicking the tray icon opens a context menu with clean operations and settings access. There is nothing flashy and that is the right design choice.
If you are coming from heavier tools like Process Hacker, the simplicity is refreshing but also a limitation. There is no per-process memory breakdown, no graph history beyond the current session, no way to identify which application caused a memory spike. The tool clears memory, it does not diagnose what consumed it.
Conclusion
Mem Reduct is best understood as a precise tool for a narrow situation rather than a general performance booster. Users who launch memory-heavy applications on tight-RAM systems, who deal with leaky long-running software, or who want a granular way to manage specific memory regions will find it useful. Users running it on autopilot because they read that “free RAM is good RAM” are mostly chasing a metric without understanding what they are doing to system performance underneath.
The tool itself is well-built for what it is. Small, open source, properly signed, with sensible defaults and clear configuration. The criticism is not of the implementation but of the category. Memory cleaners as a class are popular for reasons that mostly do not survive technical scrutiny on modern Windows.
If you understand which scenarios actually benefit and configure the tool accordingly, this is the most defensible option in the category. If you do not, you may be making your system slower while feeling good about a green tray icon.
Pros & Cons
- Targets eight specific memory regions instead of one generic trim, with the ability to exclude regions from cleaning
- Tiny footprint at under 400 KB with very low background CPU usage
- Open source under GPL-3.0 with signed release binaries
- Both portable and installer distributions, with CLI support for scripting
- Color-coded tray indicator gives at-a-glance memory pressure feedback
- Configurable threshold-based auto-clean is useful when paired with low free memory situations
- Default clean operations target the standby list, which Windows uses to speed up application launches, potentially making things slower
- The freed RAM numbers shown are larger than the actual benefit, since cached memory was already available to applications
- No diagnostic information about which processes are using memory or causing leaks
- Interval-based auto-cleaning often runs when no memory pressure exists
- Requires administrator privileges to clear certain regions, which complicates portable use
- The application's value depends on understanding Windows memory management, which the tool itself does not explain
Frequently asked questions
Sometimes. Clearing memory immediately before launching a memory-intensive application can smooth the launch. Outside that specific case, the speed improvement is often imagined rather than measured, because the cached memory it clears was already available for use.
The application empties cached regions that Windows was keeping populated for performance reasons. The memory was not "in use" by any application, it was held as cache. Clearing it makes the number look better but does not make more memory truly available than already was.
No. The application uses documented behavior (even if exposed through undocumented APIs) and cannot corrupt running processes. Windows handles the eviction of cache cleanly. The worst case is temporarily slower performance as the cache rebuilds.
The threshold-based mode is reasonable if you set a high threshold (around 90 percent) so it only triggers under genuine memory pressure. The interval-based mode is rarely useful on modern Windows, as the system manages memory better than a timer can.
Yes, the application works the same way regardless of total RAM. On high-memory systems, the benefit is smaller in relative terms because you are unlikely to encounter memory pressure in the first place. The tool is most relevant on systems with 8 GB or less.
Clearing the priority-0 standby list and the registry cache requires elevated permissions because those regions are part of the kernel-level memory management. Without elevation, the application can still trim working sets and the file cache but the deeper cleans are unavailable.