WifiInfoView

 (6 votes, average: 4.00 out of 5)
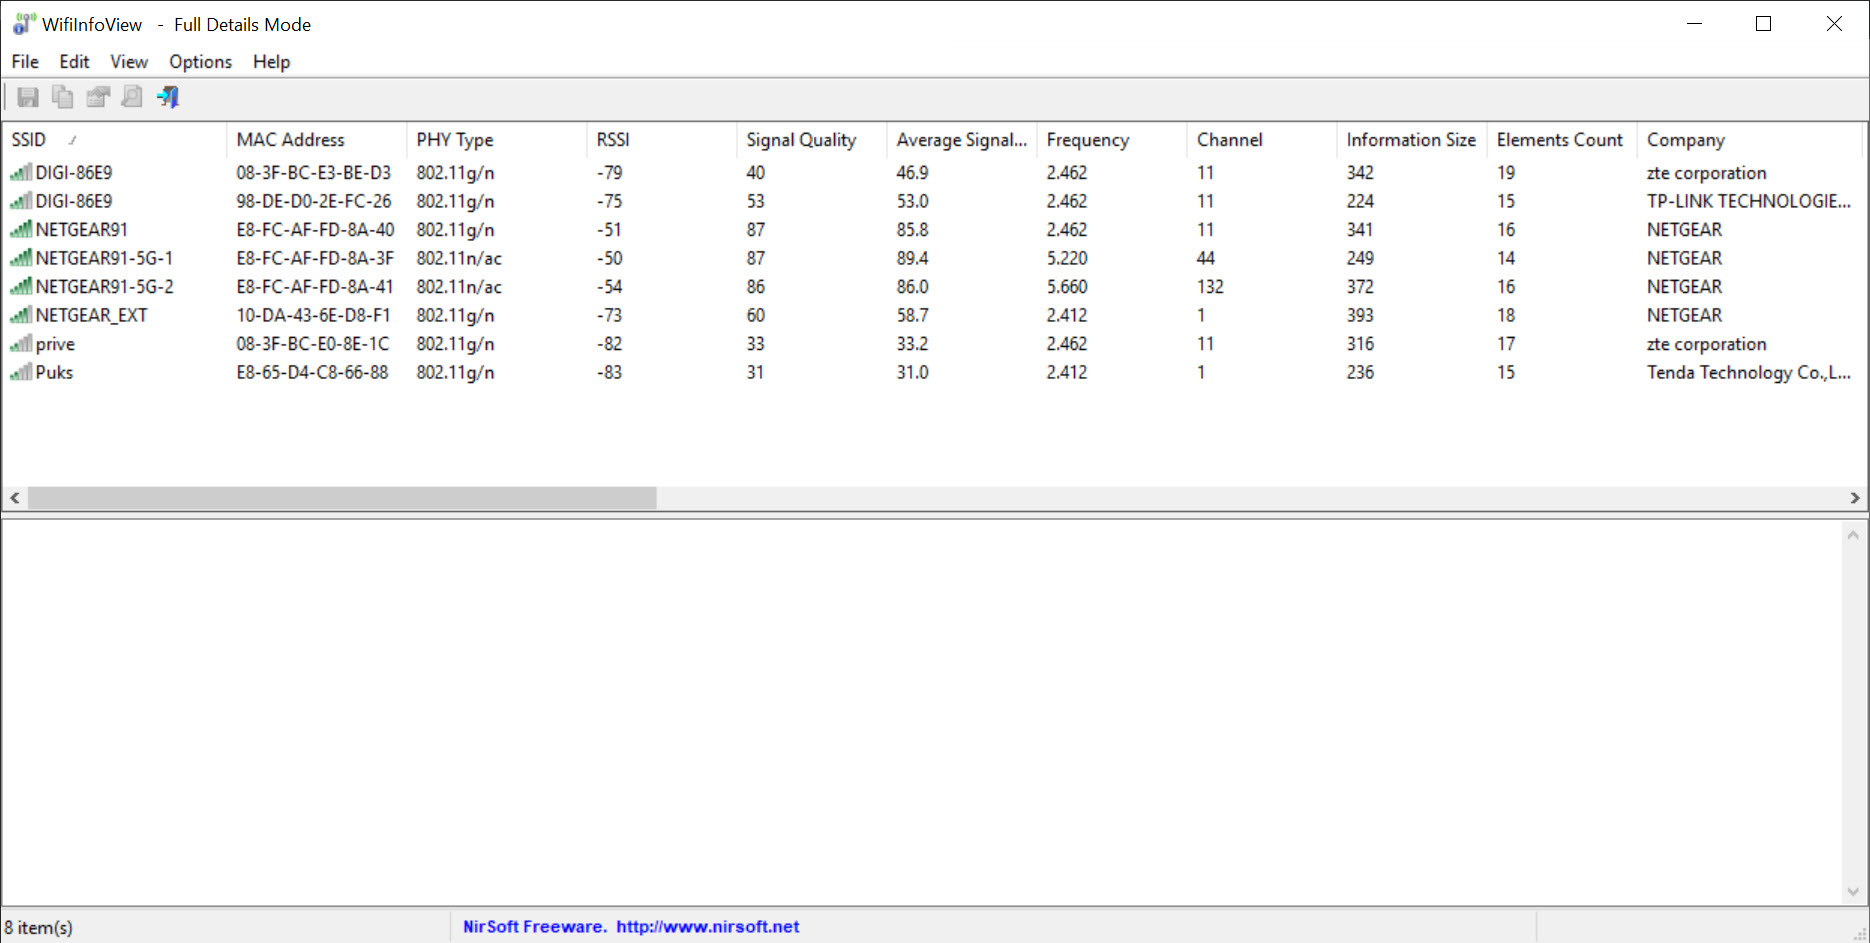
About WifiInfoView
WifiInfoView scans the wireless networks around you and lays out everything it learns in one detailed, sortable table. Where the system’s own network list shows you a name and a few signal bars, this utility shows the network name, signal quality, frequency, channel, band, security type, the router’s hardware identity, maximum supported speed, and a long row of further fields for every network it detects. It is the difference between glancing at the airwaves and actually reading them.
The format is the feature. WifiInfoView does not draw graphs or paint heatmaps, it gives you a dense grid of facts that updates as it scans, and lets you sort by any column. Want to see which networks sit on your channel? Sort by channel. Want to find the strongest signal nearby? Sort by quality. The table answers questions as fast as you can click a header.
It runs without installation, weighs next to nothing, and starts scanning the moment it opens. For quick wireless diagnostics, that immediacy is exactly what you want.
What the table actually tells you
The depth of detail is what separates this from a casual scanner. For each detected network, WifiInfoView reports the basics like name, signal, and channel, then keeps going. You see which band the network uses, what security and cipher protect it, the maximum speed the hardware advertises, and identifying information about the router itself, including the hardware maker derived from its address.
Why would you care about all that? A few concrete cases. The router identity helps you tell apart the three networks all named something generic on your street. The security column instantly flags any network still running outdated protection.
The maximum speed field reveals whether a neighbor’s equipment is newer than yours. And the channel and band data is the raw material for fixing the most common wireless problem of all, congestion, which brings us to the next point.
Finding a quieter channel
Slow wireless is very often crowded wireless. When several networks share the same channel, they take turns talking, and everyone’s speed suffers. The fix is moving your router to a channel with fewer neighbors, and WifiInfoView gives you the evidence to pick one well.
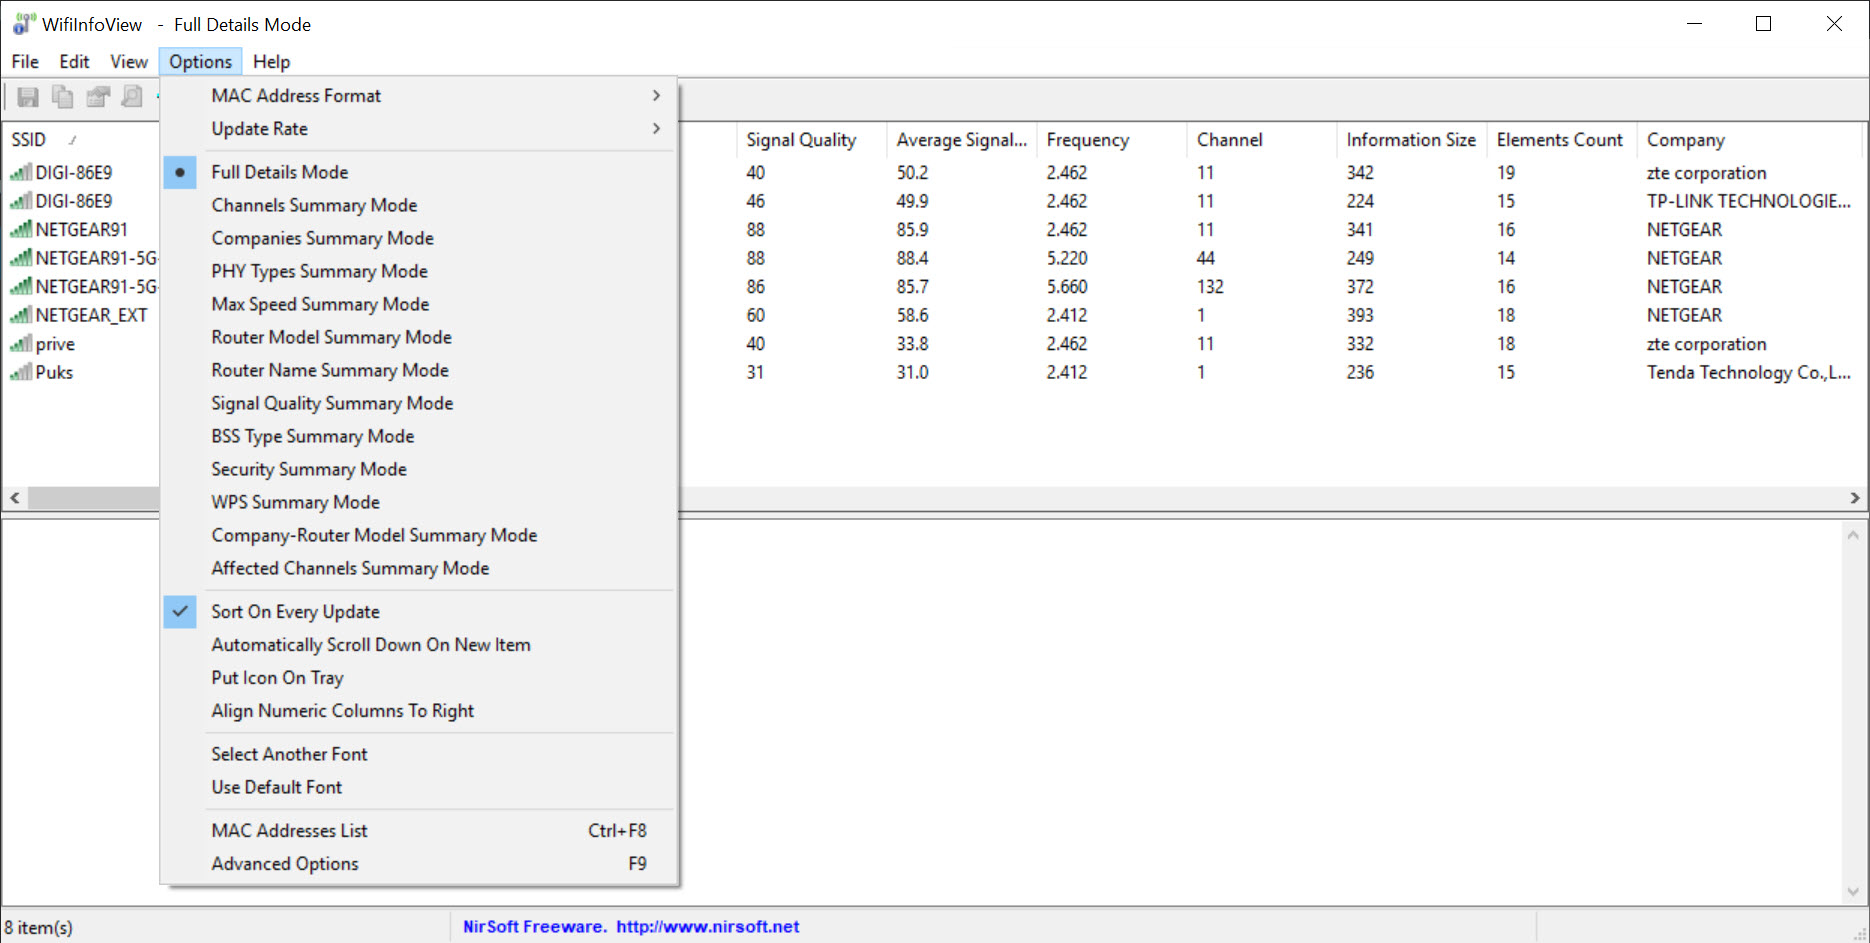
Sort the table by channel and the crowding becomes obvious at a glance, a cluster of rows stacked on one channel and near-empty space on another. The tool even includes a summary mode that groups detected networks by channel, turning the question “where is it quiet?” into a single view.
Change your router’s channel based on what you see, rescan, and confirm the neighborhood thinned out. If you then want to go further and map how signal behaves across the rooms of your home, a survey tool like NetSpot picks up where the table leaves off with its floor-plan heatmaps. The two make a natural pair, one for the facts, one for the map.
Built for quick diagnostics
The working style here is grab, look, done. Because the tool needs no setup, you can keep it on a USB stick and run it on any machine that needs a wireless checkup. It starts scanning immediately, refreshes on its own, and the whole interface is the table, so there is nothing to learn beyond clicking column headers.
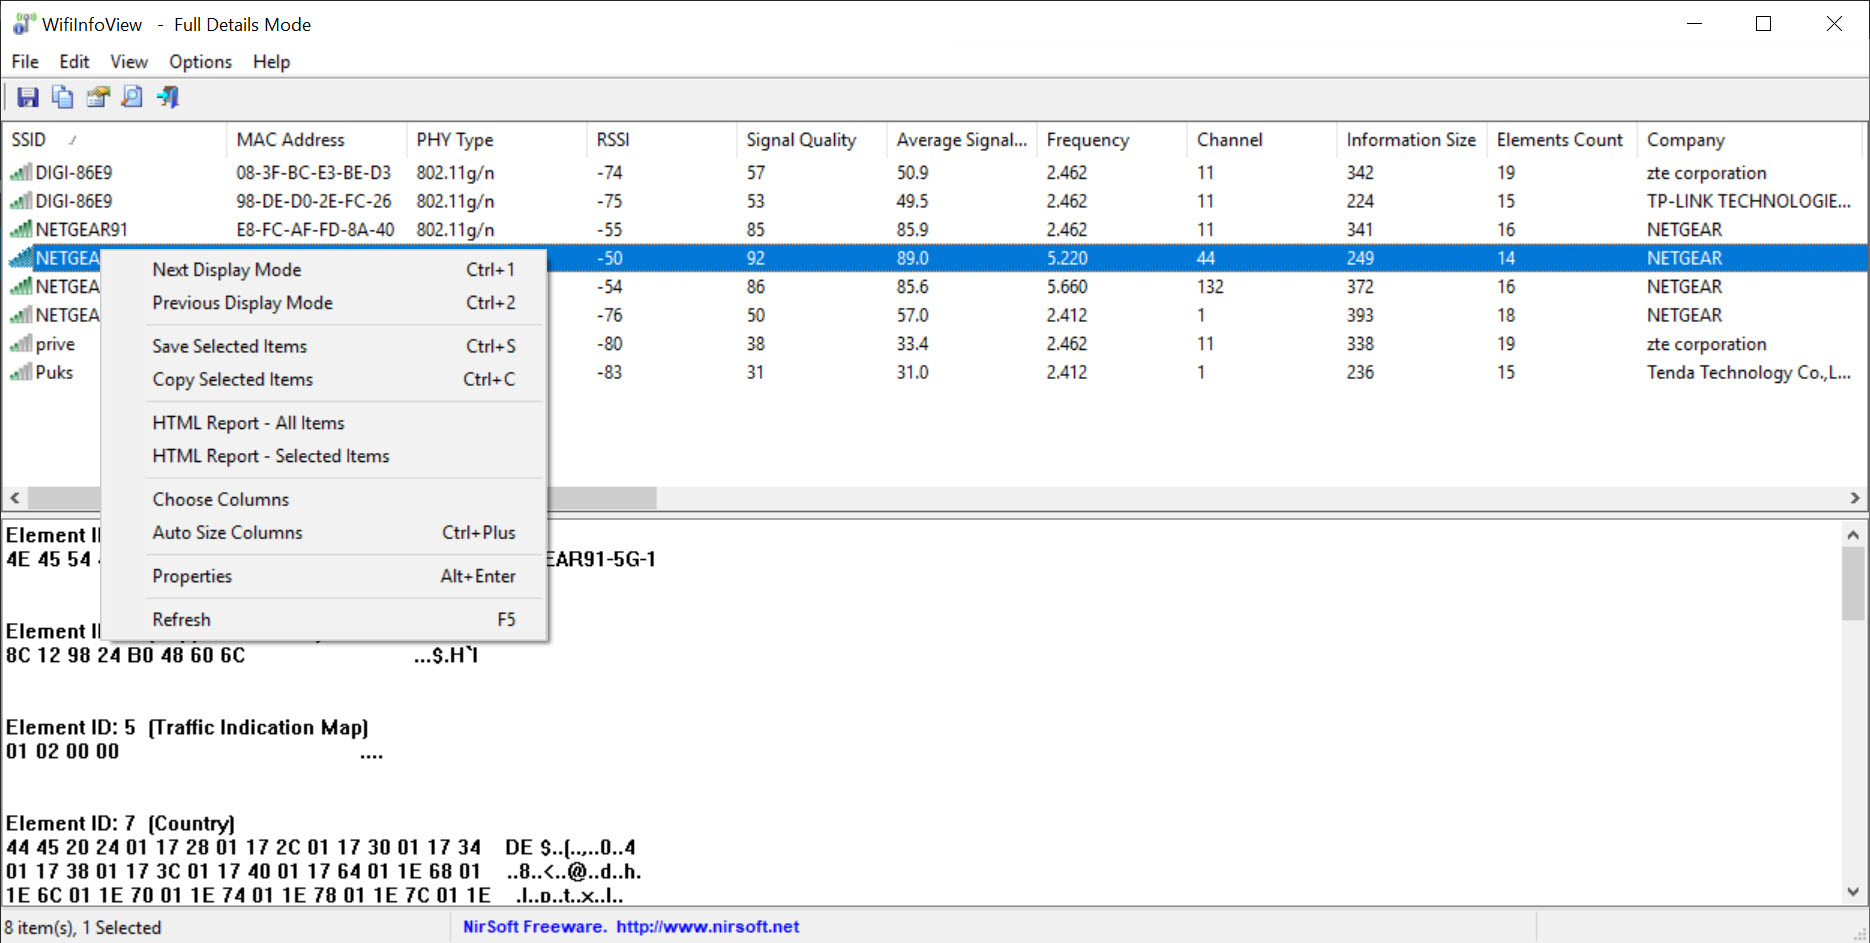
When you need a record of what you found, it exports. The scan results can be saved out to formats like HTML and CSV, which turns a moment’s diagnosis into documentation, handy if you are troubleshooting a relative’s connection and want to compare before and after, or keeping notes across several locations.
Double-clicking a network opens its full detail in one window, every field at once, for when a single row deserves a closer look.
Where it sits among wireless scanners
This category has several good citizens, and they split by personality. WifiInfoView is the data purist’s pick, maximum detail, minimum decoration. If you prefer visual signal graphs that show networks rising and falling over time, inSSIDer presents the same airwaves more graphically. And if your question is not “what networks are around me” but “what devices are on my own network,” that is a different job answered by Wireless Network Watcher instead.
The honest limitation is the flip side of the design. There are no charts, no historical tracking, no surveys, and the sheer number of columns can feel like staring at a spreadsheet if you only wanted to know why the internet is slow. But ask it a precise question, which channel, what security, whose router, and the table answers faster than any prettier tool would.
Conclusion
WifiInfoView is for the person who wants answers from the airwaves, not pictures of them. The dense, sortable table surfaces more about nearby networks than most tools twice its size, and the instant, no-install startup makes it the natural first responder when a connection misbehaves. Sorting by channel alone solves a remarkable share of everyday wireless complaints.
It deliberately skips the visual flourishes, so anyone wanting graphs, history, or coverage maps should pair it with or choose a more visual tool. But as a fast, factual wireless scanner that fits on a USB stick and answers precise questions immediately, it is hard to beat, and its plainness is exactly why technicians keep it within reach.
Pros & Cons
- Shows deep per-network detail far beyond the system's basic list
- Sortable columns answer specific questions with a single click
- Channel summary mode makes congestion and quiet channels obvious
- Runs instantly with no installation, ideal for a USB diagnostic kit
- Exports scan results to formats like HTML and CSV for documentation
- No graphs, heatmaps, or historical tracking, just the live table
- Column density can overwhelm users who wanted a simple answer
- Reads the airwaves only, with no tools to change any settings
- Surveys and coverage mapping require a separate application
Frequently asked questions
It lists the network name, signal quality, frequency, channel, band, security and cipher type, the router's hardware identity, maximum supported speed, and a range of further technical fields, all in one sortable table.
It can point you to the most common cause. By sorting or summarizing networks by channel, you see exactly where the congestion is and which channels are quieter, so you can move your router and confirm the improvement with a rescan.
No. It runs as a standalone tool the moment you open it, which makes it easy to carry on a USB stick and use on any machine you are troubleshooting.
Yes. Scan results export to formats like HTML and CSV, so you can document a location's wireless environment or compare results before and after a change.
No. It is strictly a viewer. It reads and reports what is broadcast around you, and any changes, like switching your router's channel, happen in your router's own settings.