

Sonic Visualiser
 (2 votes, average: 5.00 out of 5)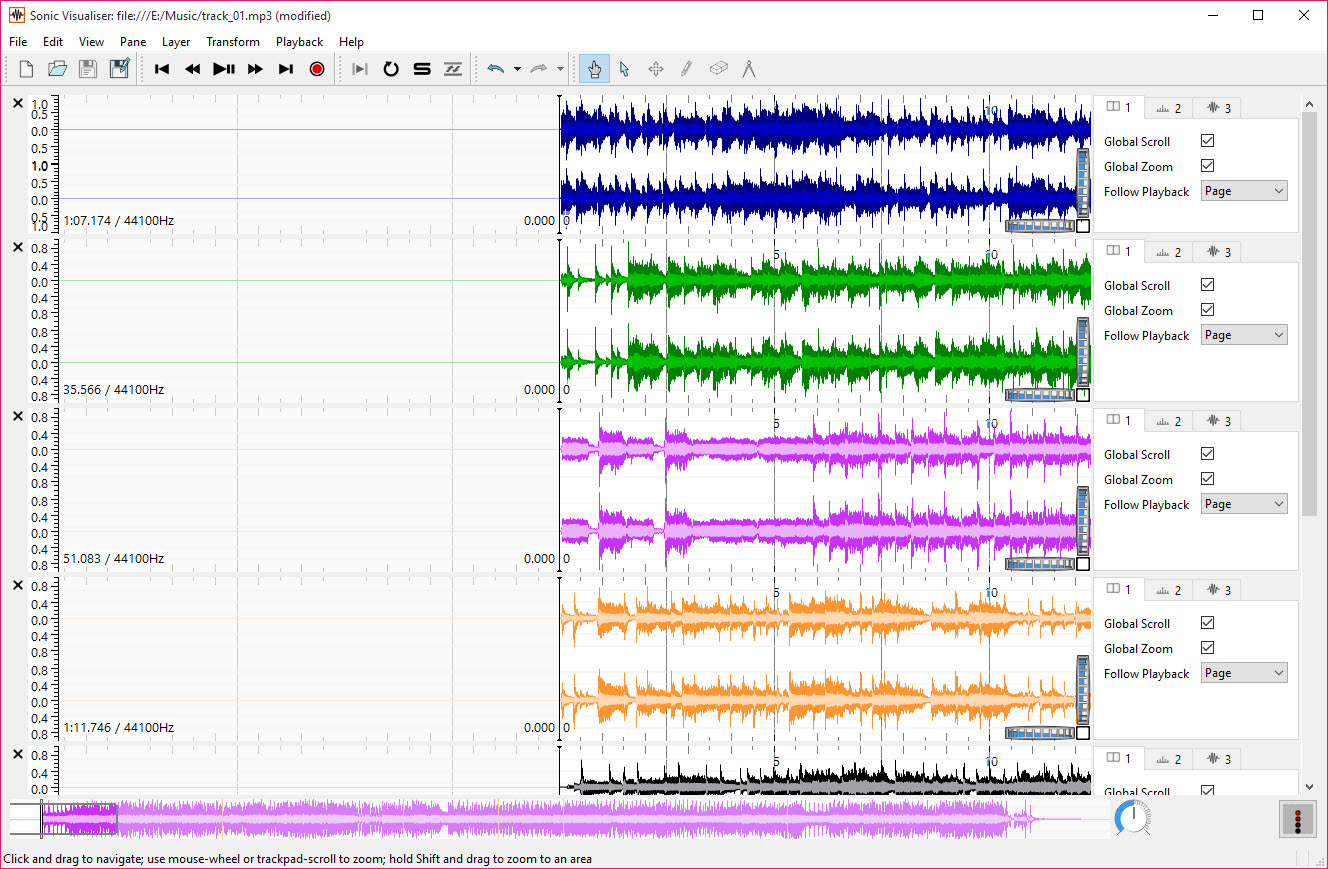
About Sonic Visualiser
Some software plays music, some edits it, and a small third category exists to study it. Sonic Visualiser belongs firmly to that last group. It opens an audio file and turns it into something you can examine, waveforms, spectrograms, pitch curves, beat grids, layered over the same timeline like transparencies on a light table. Nothing here cuts, pastes, or applies reverb.
You look at music the way a biologist looks through a microscope, and for transcription, musicology, or plain curiosity about what your ears are hearing, that turns out to be a surprisingly deep activity.
The tool built its reputation in music research, and it shows in the best sense. Measurements are precise, every visual can be annotated, and an entire plugin system exists to extract musical information automatically. It also shows in the worst sense, since the interface has the charm of laboratory equipment. Push through anyway, and here is why.
Panes, layers, and what a spectrogram actually tells you
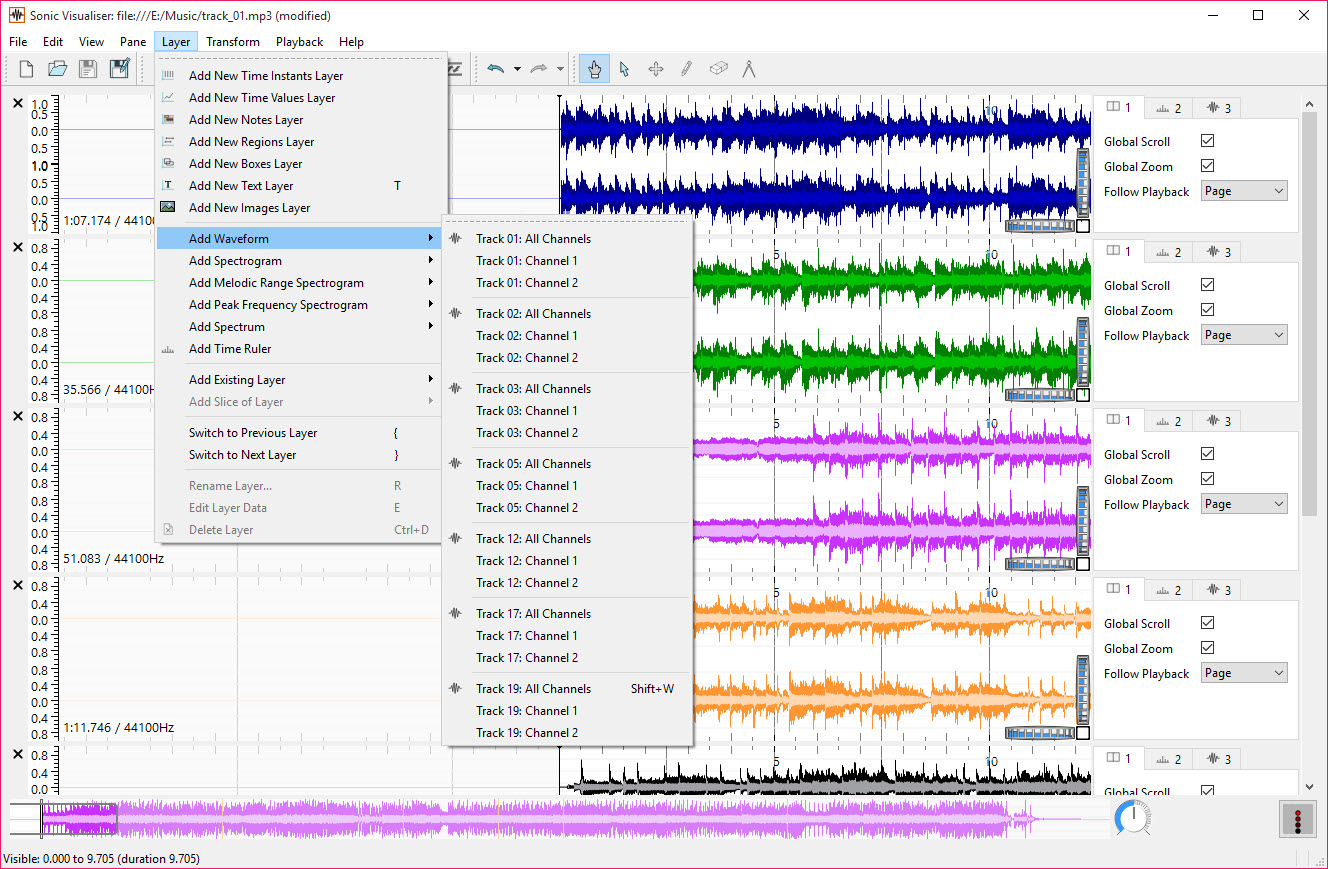
The working model takes ten minutes to click. The window splits into panes, each pane holds layers, and layers can be anything, a waveform, a spectrogram, your own markings. Stack a spectrogram under a pitch track and both scroll together as the file plays.
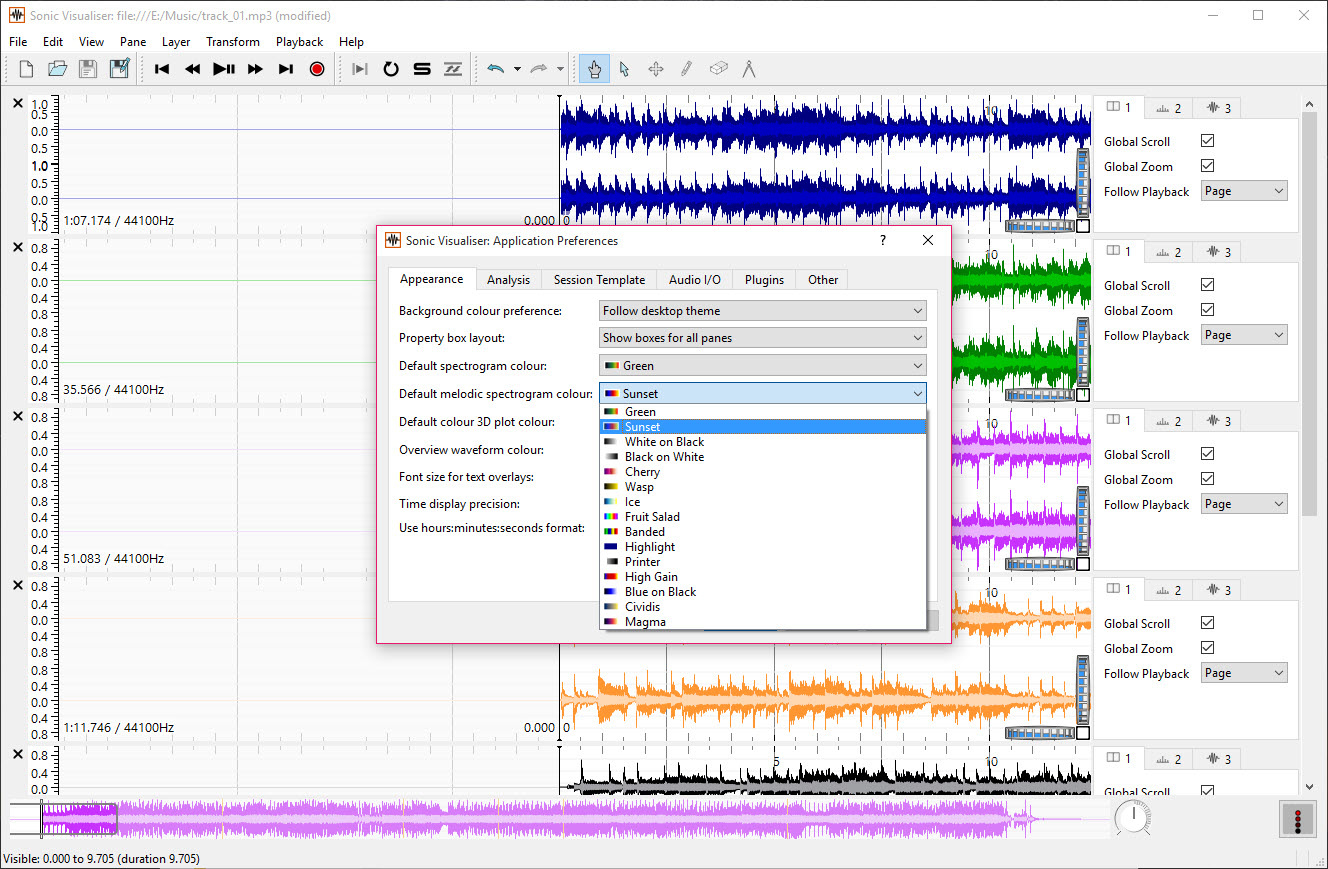
The spectrogram is where most discoveries happen. Where a waveform shows only loudness over time, the spectrogram spreads sound into its frequencies, so a chord appears as parallel bright bands, a hi-hat as a vertical splash of noise, a singer’s vibrato as a wobbling line. Sonic Visualiser includes a melodic range variant tuned to musical pitches rather than raw frequency, which makes following a bass line or a vocal melody noticeably easier, and hovering anywhere reads out the exact frequency and time.
Guitarists trying to identify a note buried in a mix, producers checking how low a kick drum actually reaches, and students learning what sound looks like all end up staring at this view for hours.
Slow the music down, keep the pitch
For anyone transcribing by ear, one feature justifies the whole download. Playback speed drops to a crawl without changing pitch, so a solo recorded at full tempo becomes a patient dictation exercise in the original key. Select four bars, loop them, slow them to half speed, and pick out notes one at a time while the spectrogram confirms what you think you hear.
This combination, looped selection plus time-stretched playback plus a visual pitch reference, beats the pause-rewind ritual musicians have suffered through forever. Piano players working from the visual side might pair the analysis with a trainer like Synthesia, but for lifting parts off real recordings, this is the sharper instrument.
Vamp plugins do the tedious listening for you
The plugin system, called Vamp, is what separates Sonic Visualiser from a pretty spectrogram viewer. These are analysis modules that process the audio and return musical information as new layers. A beat tracker lays a grid of detected beats across the file and estimates the tempo. An onset detector marks every note attack. A pitch tracker draws the melody as a curve, a chromagram summarizes which pitch classes sound at each moment, useful groundwork for working out the harmony, and key estimators offer their opinion on the tonal center.
The results are suggestions, not verdicts. Beat trackers stumble on rubato, pitch trackers get confused by dense polyphony, and part of using the application well is learning when to trust the machine and when to correct it.
The correcting is built in, every generated layer can be edited by hand afterward. Plugins install separately, a small friction, and the range available covers everything from tempo research to note-level transcription helpers.
Annotate, measure, export
Analysis you cannot get out of the program has limited value, and here the design is generous. Tap a key while the music plays and time-instant markers land on every tap, the fastest way to mark beats or section boundaries by feel. Draw regions over verses and choruses, attach labels, place note annotations against the melodic spectrogram until you have effectively transcribed the passage.
Everything exports. Annotation layers leave as CSV for spreadsheets and research work, note layers as MIDI for a sequencer, images of the whole layered display for articles and teaching material.
Sessions save with all layers intact, so a half-finished transcription resumes exactly where it stopped. And when the analysis reveals something you want to change in the audio itself, that is the moment to hand the file to Audacity or ocenaudio, because no editing happens here, by design.
Conclusion
Sonic Visualiser suits musicians who transcribe from recordings, students and researchers studying performances, and anyone whose questions about music start with what is actually happening in there. For that audience it offers a depth of inspection nothing playback-oriented approaches, and all it asks is the patience to learn its layered way of thinking.
People wanting to fix, trim, or master audio are simply in the wrong aisle. This is the microscope, not the scalpel, and as microscopes go it is a well-made one.
Pros & Cons
- Spectrogram views with a melodic range mode that makes pitches readable
- Time-stretched playback lets you slow passages without altering the key
- Vamp plugins detect beats, onsets, pitch curves, and harmonic content automatically
- Tap-along annotation and hand editing of every generated layer
- Exports annotations to CSV, notes to MIDI, and full session files
- No editing of any kind, strictly an analysis and annotation tool
- Utilitarian, research-grade interface with a real learning curve
- Automatic analysis needs manual correction on complex material
- Vamp plugins install separately rather than shipping in the box
Frequently asked questions
For studying recordings rather than changing them. It visualizes audio as waveforms and spectrograms, extracts beats, pitches, and harmonies through plugins, and lets you annotate and export everything you find.
Yes, that is its strongest everyday use. Loop a passage, slow it down without changing pitch, and read the melodic spectrogram as a second opinion while you work out the notes.
Through Vamp plugins, yes. A beat tracker marks detected beats and estimates tempo, and the markers stay editable, so you fix the spots where the algorithm loses the pulse.
No. There is no cutting, no effects, no repair. It analyzes and annotates, and any actual editing belongs in a separate audio editor.


