

Sniffnet
About Sniffnet
Sniffnet answers a question most people have asked their router at some point. What is this computer actually talking to right now? It watches a network adapter in real time and turns the raw packet stream into something readable, live traffic charts, a table of active connections with domain names and country flags, and plain-language service labels instead of bare port numbers. Open source and written in Rust, it starts in seconds and explains itself as it goes.
The positioning is deliberate and refreshing. Full packet analyzers like Wireshark show every byte and demand protocol knowledge to interpret any of it. Taskbar meters show a number and nothing else. Sniffnet occupies the space between, enough detail to identify every conversation your machine is holding, presented so a curious non-specialist can follow along.
One requirement comes first. Like every tool that reads packets, it needs a packet capture driver present on the system, and it will say so plainly at startup if one is missing.
Watching the wire in real time
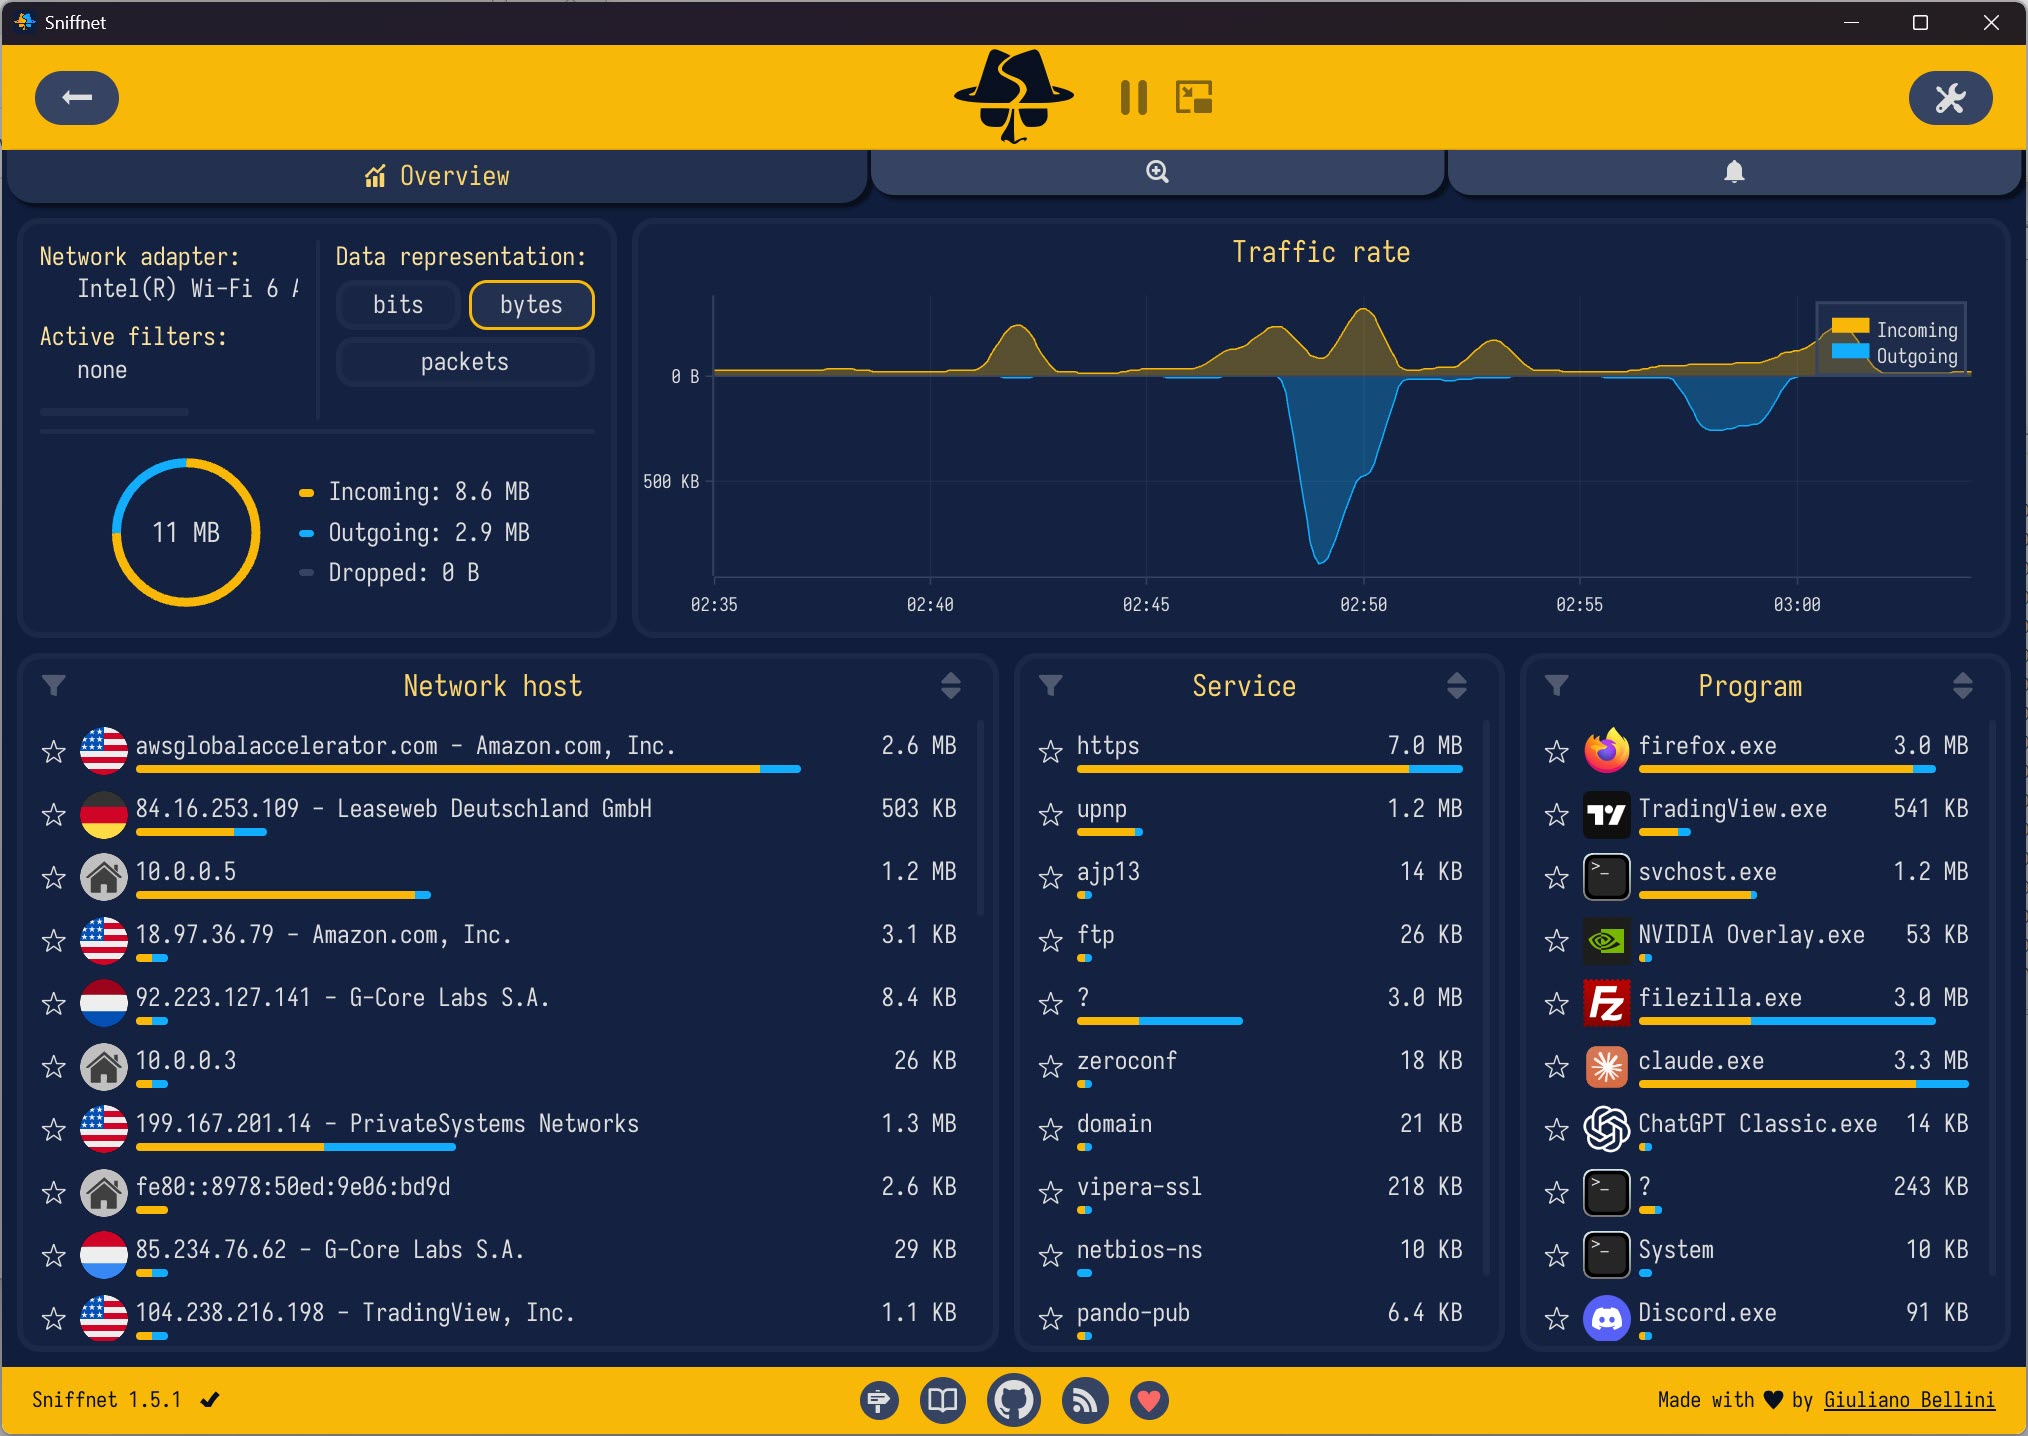
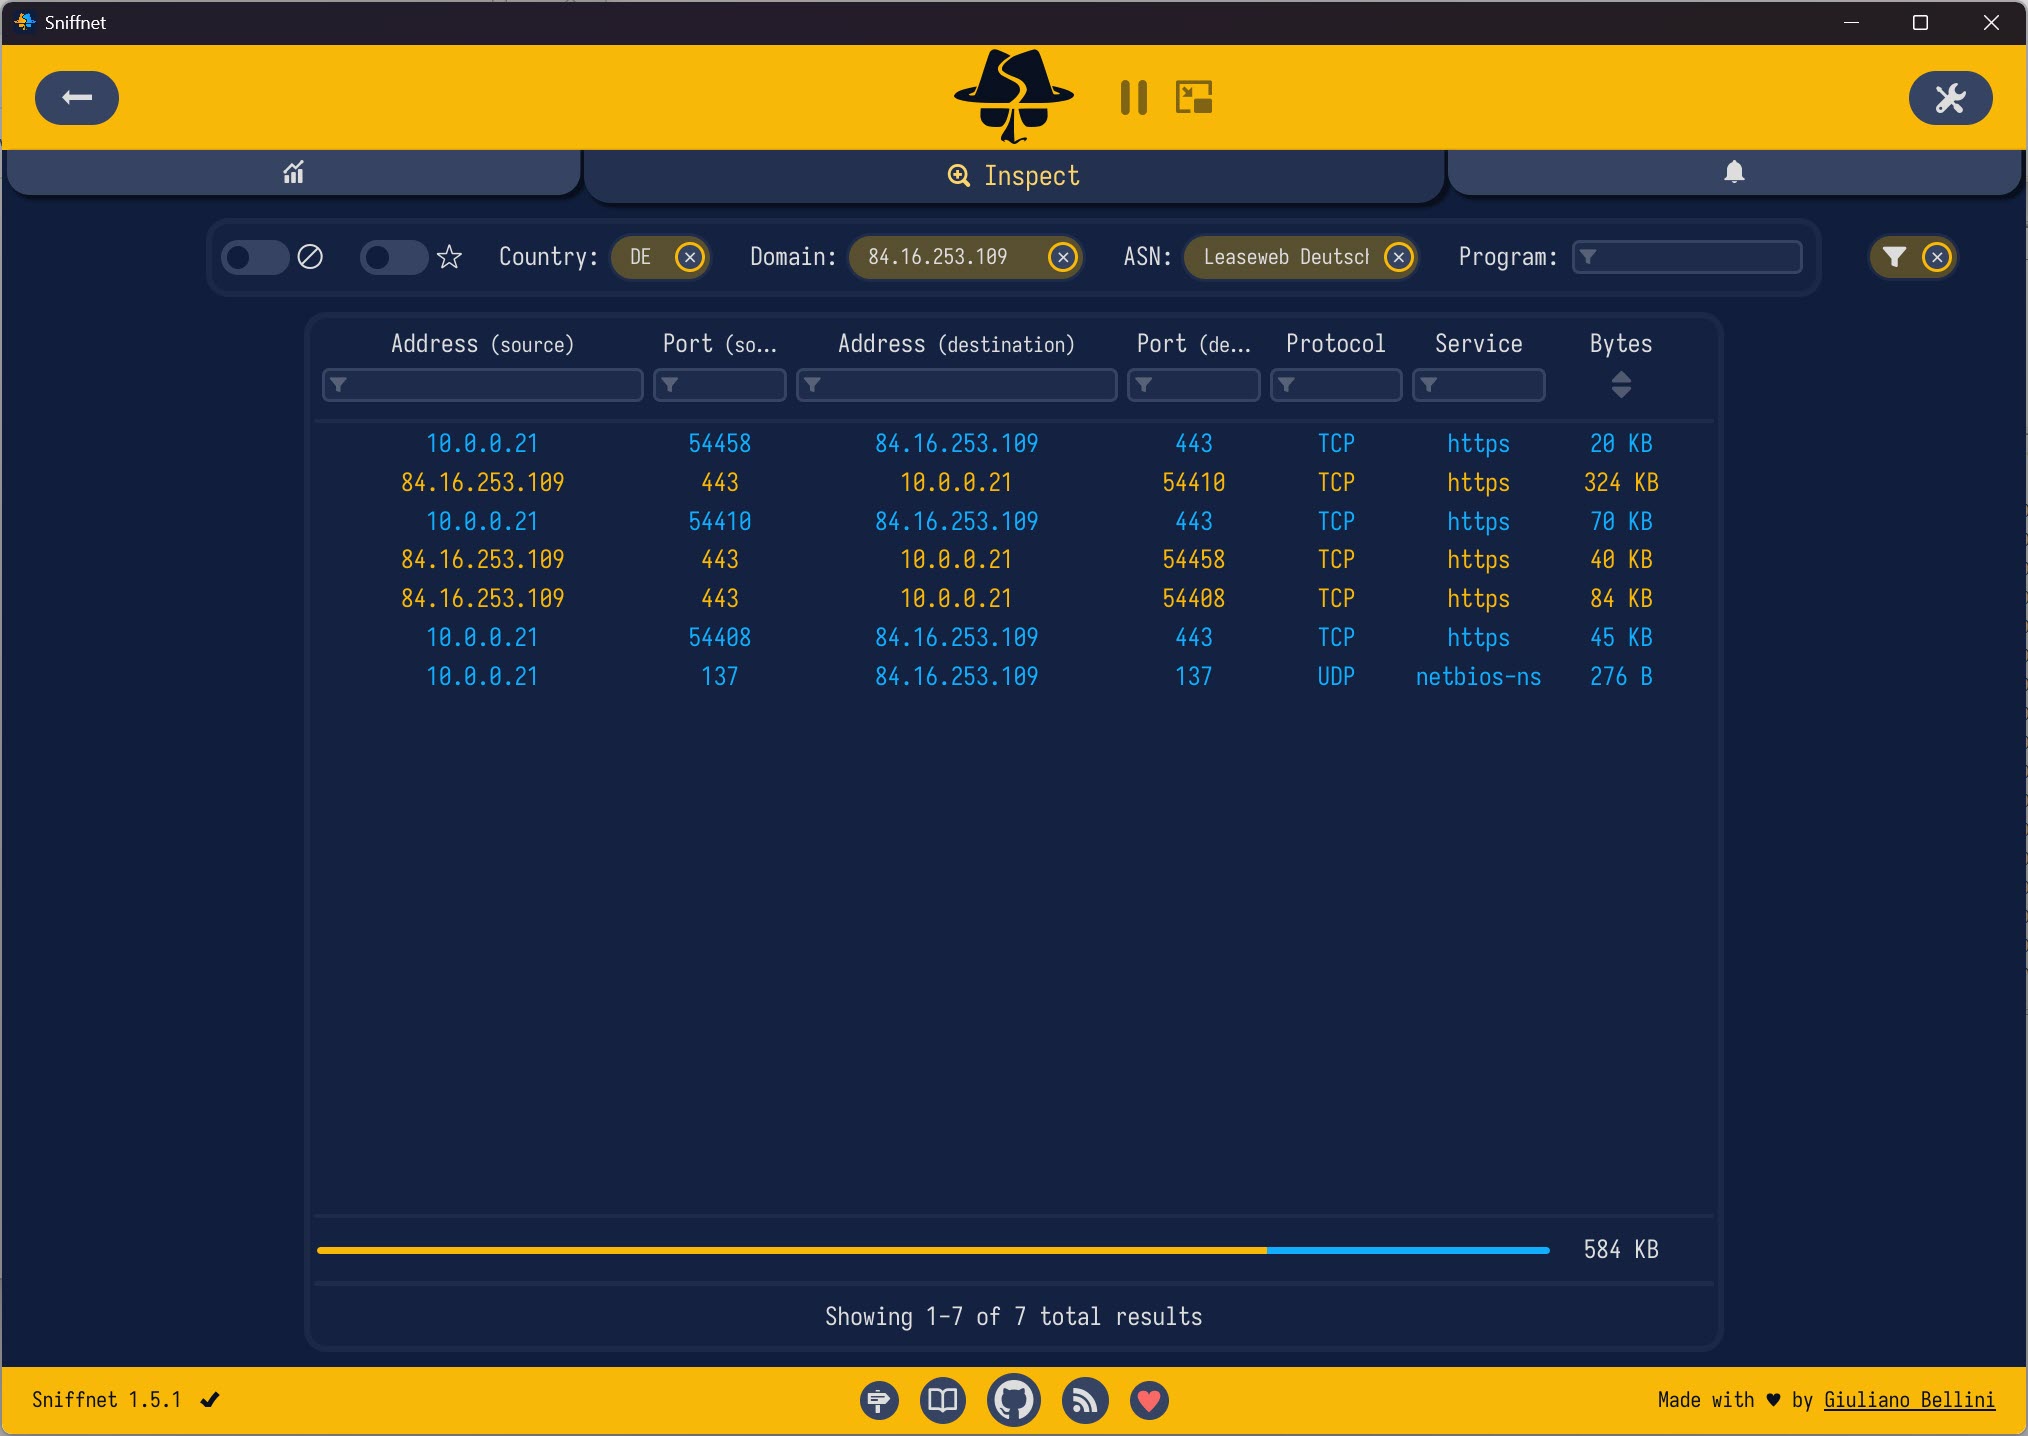
A session starts with three choices, the network adapter to observe, and optional filters for IP version, transport protocol, and ports. From there the dashboard takes over. Traffic charts plot incoming and outgoing rates live, and the connections view lists every remote host with its resolved domain name, geographic location as a country flag, the network it belongs to, and the service being spoken, mapped from a dictionary of several thousand port and protocol combinations.
That last touch does the most explaining. A row showing a video call service or a game platform’s update traffic tells an immediate story, where the same row as a naked IP and port would tell most people nothing. Reverse DNS fills in the names, and full-text search cuts through busy sessions, so typing a name or domain fragment instantly filters the table to matching conversations.
The inspection stops at the envelope, though. Sniffnet reads addresses, volumes, and protocols, never message contents, so it identifies who your machine talks to and how much, not what was said.
Favorites, thresholds, and the little window that stays on top
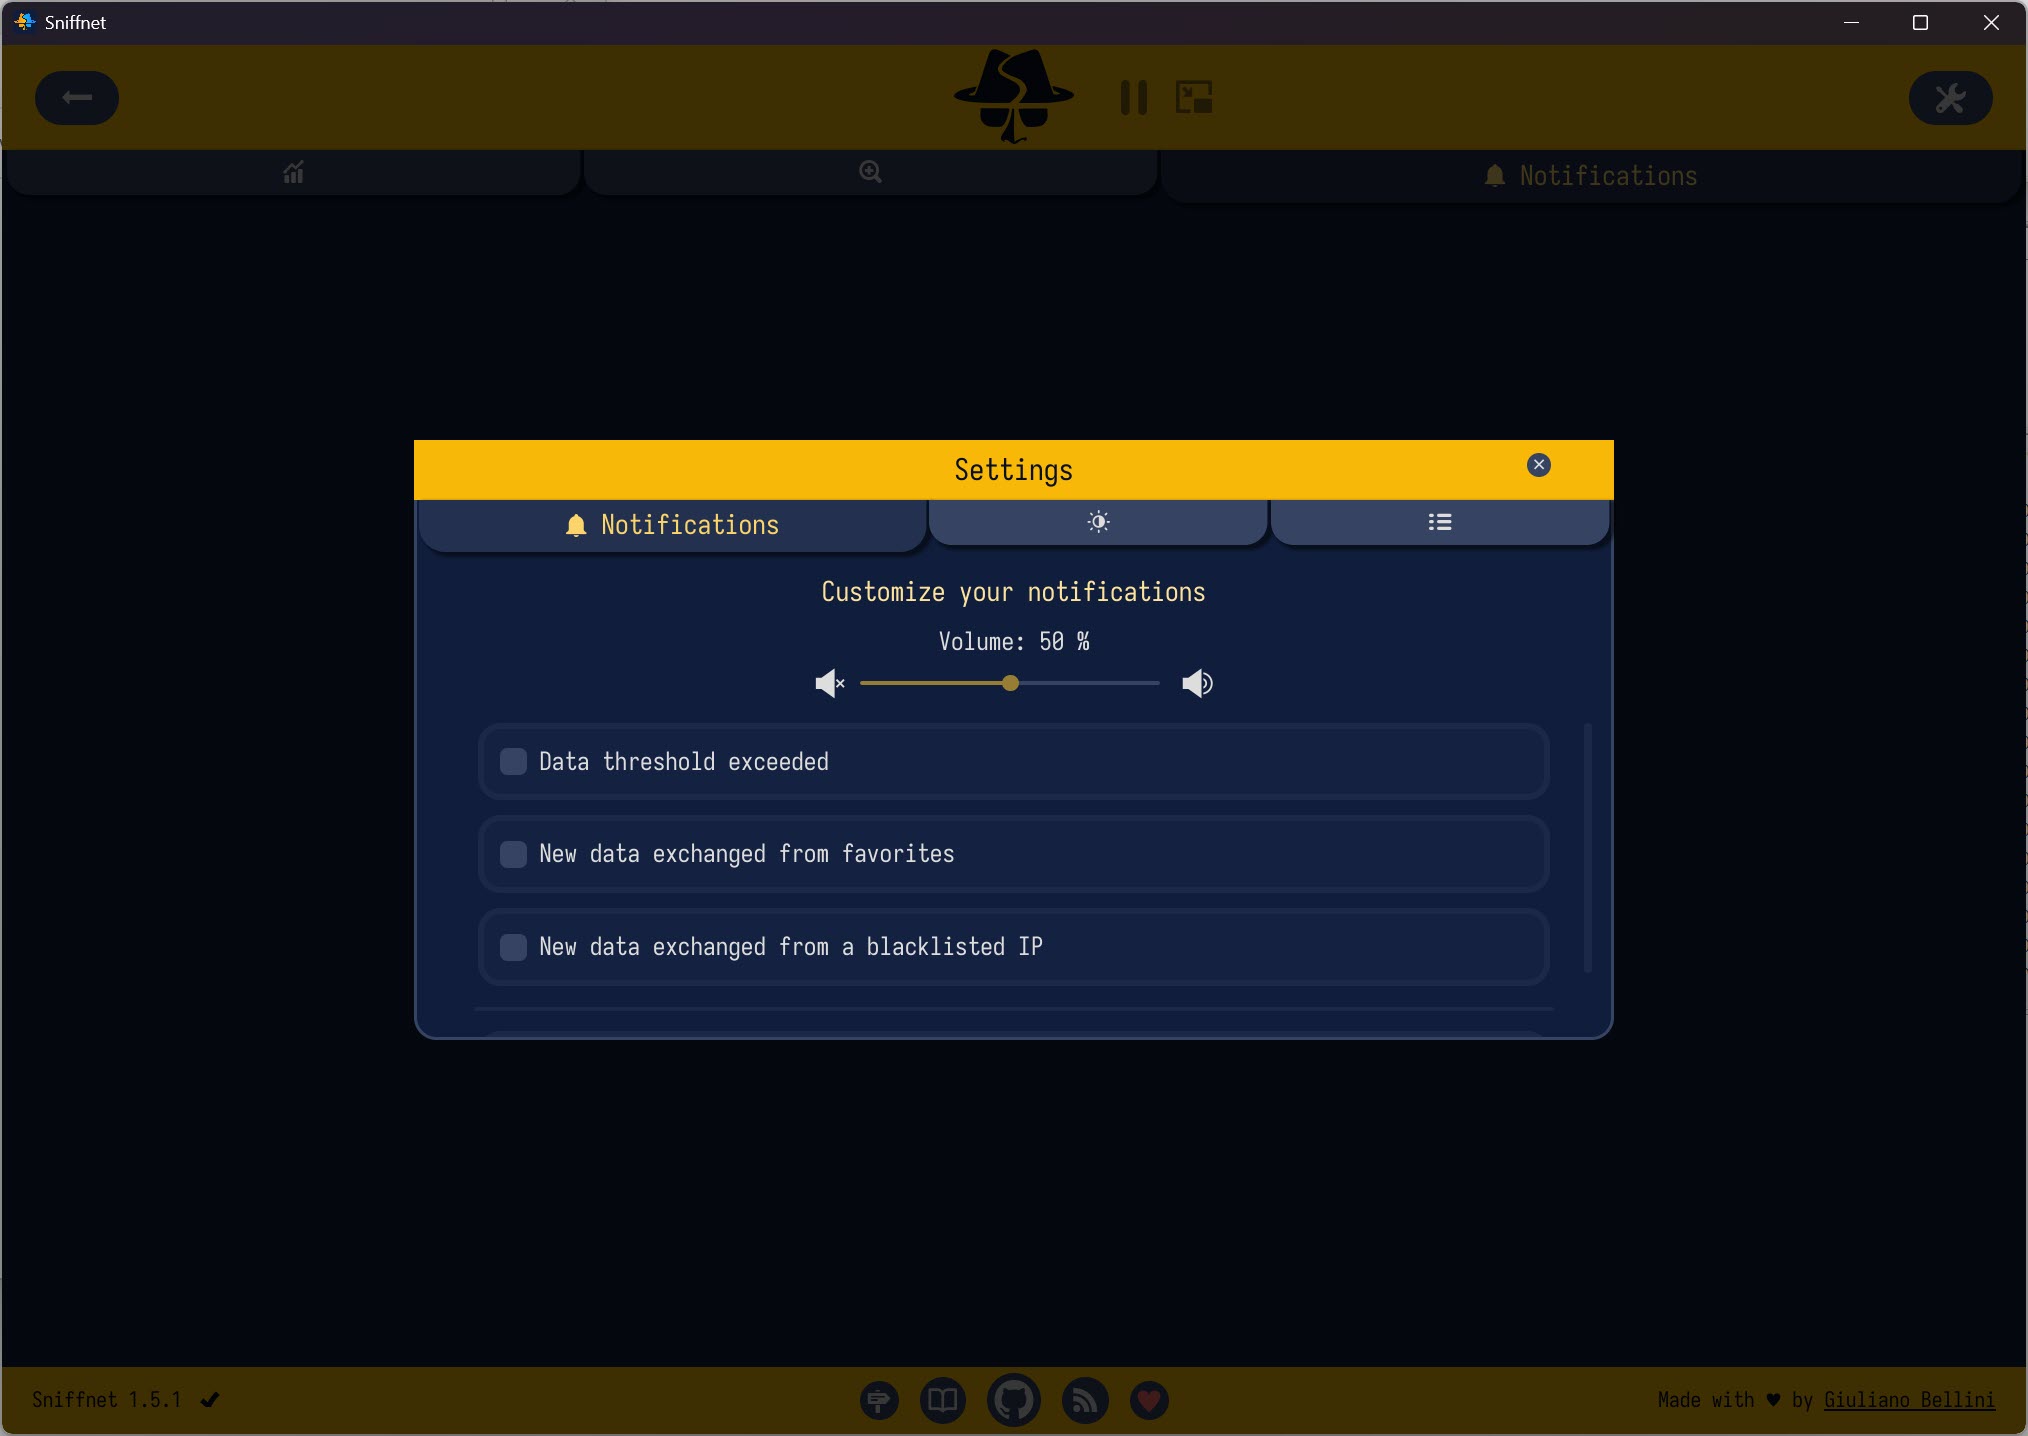
Hosts can be starred as favorites, and the notification system builds on that. An alert can fire when traffic crosses a byte-per-second threshold you set, or when any data at all moves to or from a favorite host, which turns the tool from a passive chart into a tripwire. Wondering whether some device or program phones a particular server at night stops being speculation, since the notification arrives with a timestamp.
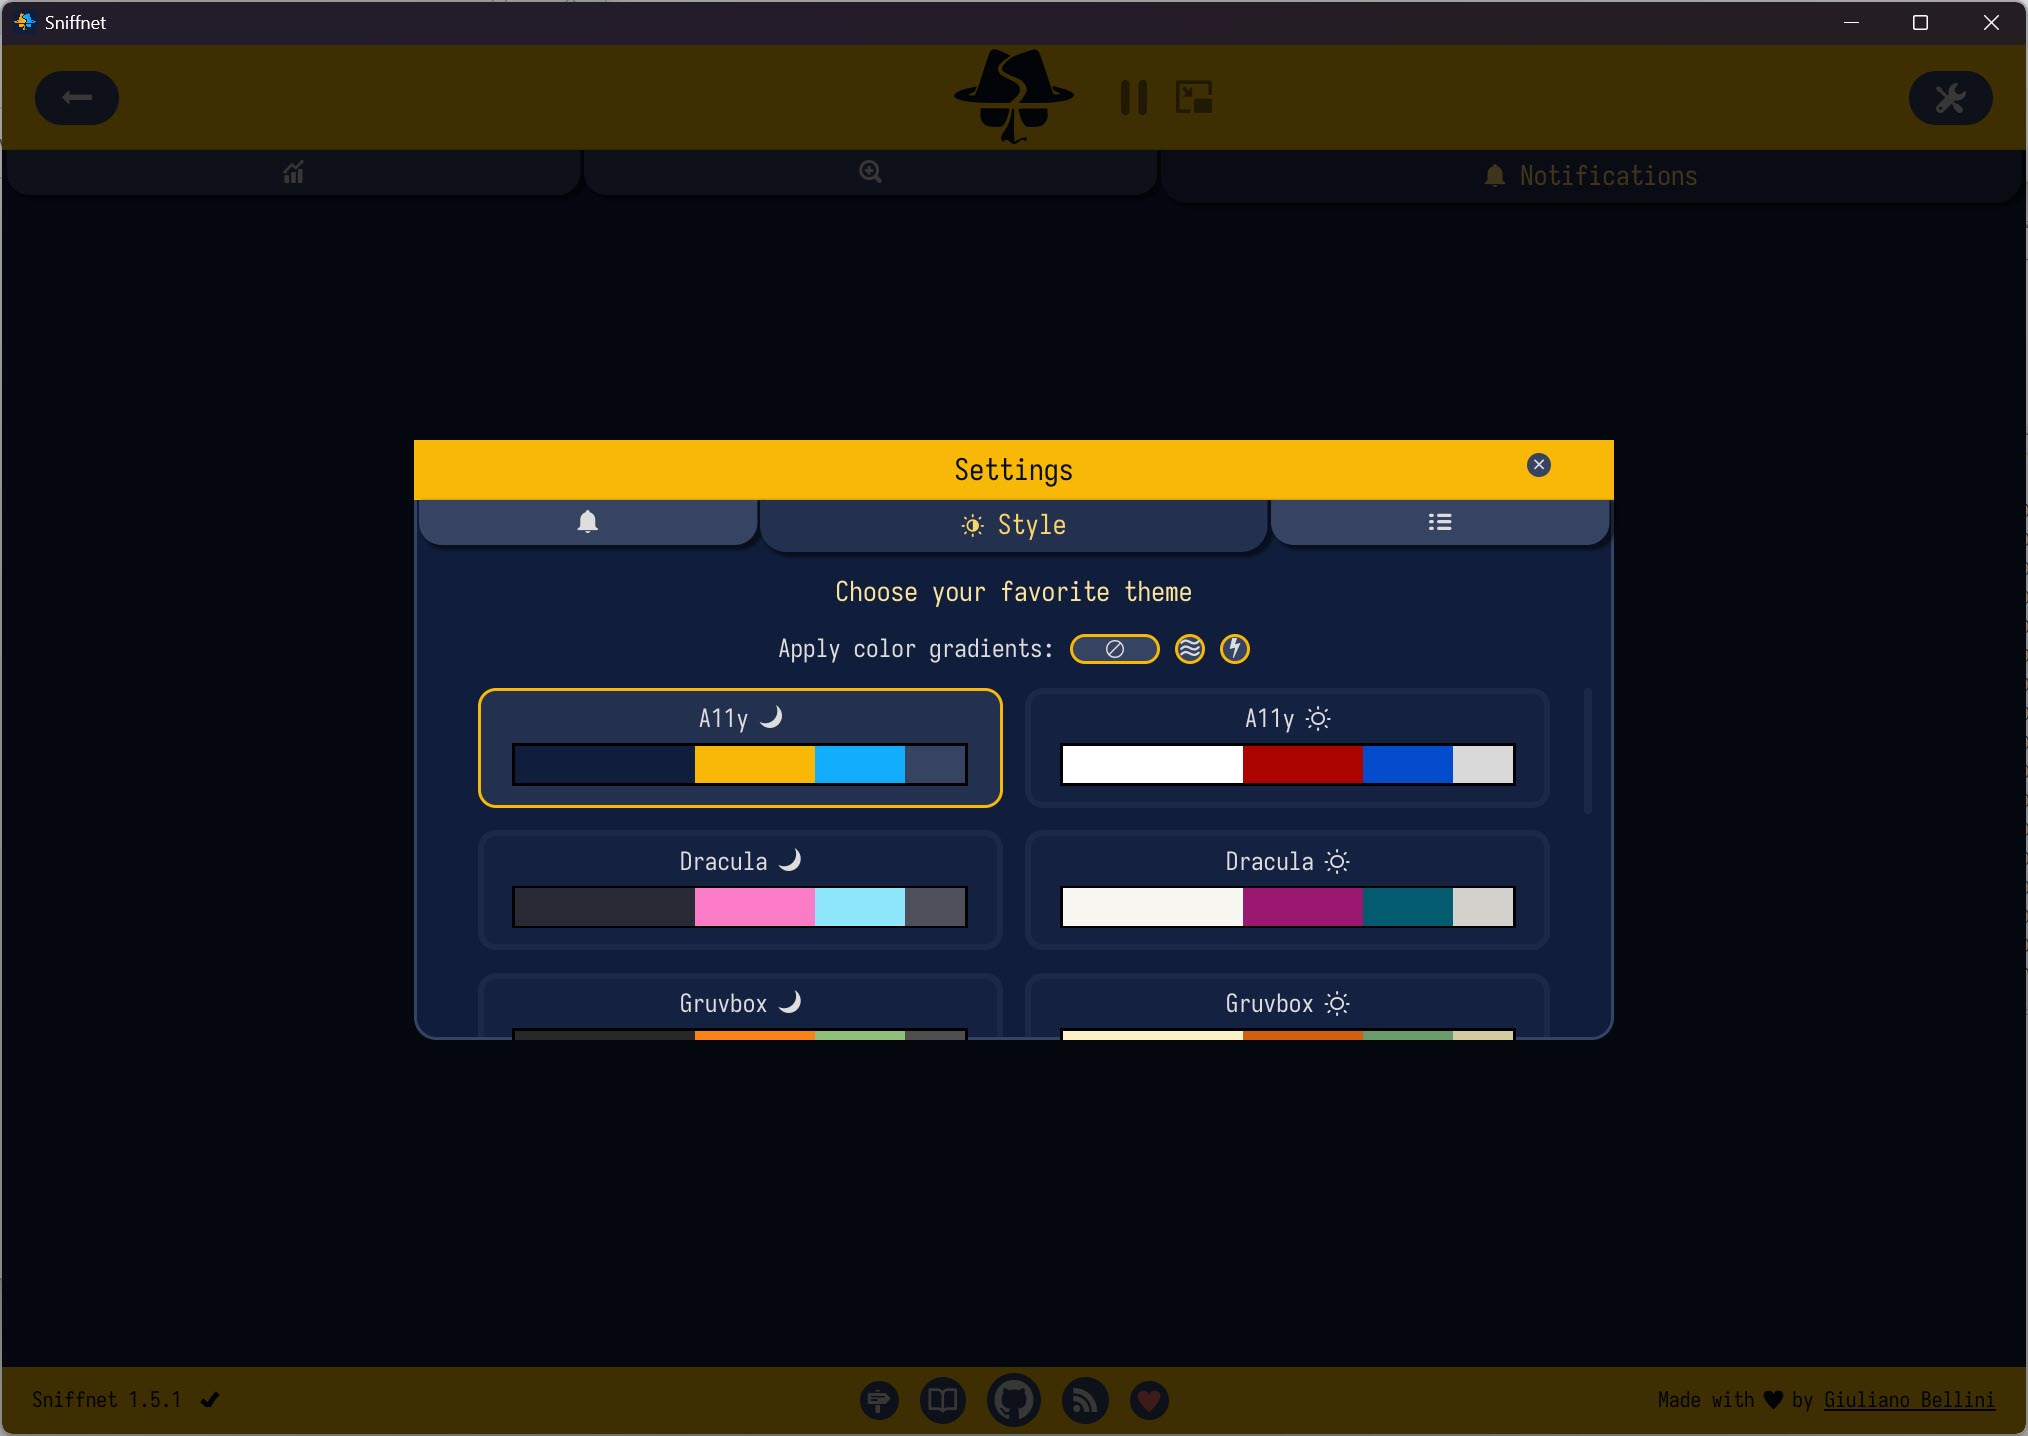
A thumbnail mode shrinks the whole affair into a small always-on-top window, the network equivalent of a rearview mirror, and it’s the mode people end up leaving on for days. Everything wears one of several themes, including fully custom ones, and the interface speaks a few dozen languages, small comforts that signal how much care went into the surface.
PCAP files, in and out
Sessions can be exported as standard PCAP capture files, which makes this tool a friendly front door to a deeper investigation. Spot something odd in the connection table, export the capture, and hand the file to a full analyzer where payload-level dissection lives.
The reverse works too, since existing PCAP files import for browsing with the same charts and readable labels, and reviewing an old capture here is far gentler than scrolling raw packet lists.
That workflow, observe here and dissect elsewhere, is honest about the division of labor and works better than either tool alone.
What it deliberately leaves out
The largest omission is per-application attribution. Traffic is observed at the adapter, so Sniffnet shows conversations by remote host, never by which local program created them. When the question is “which app is uploading”, a per-process monitor like GlassWire answers directly.
A process-level view such as Process Hacker ties sockets to programs in real time as well. Pairing one of those with the connection detail here covers both angles.
History is session-bound as well. Charts and tables live while the capture runs, and nothing accumulates into a long-term database of usage by day or month. And for discovering which devices sit on the network rather than what one machine says, a scanner like Wireless Network Watcher handles the neighbor question this tool doesn’t ask.
Conclusion
Sniffnet suits the curious and the mildly suspicious, people who want to see their machine’s conversations without earning a networking certificate first, plus admins who need a fast visual triage before reaching for heavier instruments. The favorites tripwire and the PCAP bridge give it real investigative use beyond the pretty charts.
Anyone needing per-app accounting or payload analysis will pair it with other tools rather than replace them. As the readable window onto the wire, it has no equal at this level of simplicity.
Pros & Cons
- Live connection table with domain names, countries, and readable service labels
- Notifications trigger on thresholds or on any traffic with favorite hosts
- Imports and exports standard PCAP files for deeper analysis elsewhere
- Always-on-top thumbnail mode keeps traffic in the corner of your eye
- Clean, fast, open-source design that explains itself to non-specialists
- No per-application view, traffic is only grouped by remote host
- No packet payload inspection of any kind
- Statistics vanish with the session, with no long-term history
- Requires a separate packet capture driver on the system
Frequently asked questions
No, it observes the network adapter and groups traffic by remote host, not by local process. Pair it with a per-application monitor when the question is about a specific program.
No, it works with connection metadata, addresses, ports, protocols, and volumes. Message contents are never decoded or displayed, which also keeps casual monitoring on the harmless side.
Reading raw packets requires a capture driver on the system, the same dependency every packet tool shares. Install one, restart the app, and the adapter list appears.
Yes, mark the host as a favorite and enable favorite notifications. Any exchange with it triggers an alert, which is the standard way to catch scheduled or hidden phone-home behavior.
The file opens in any standard packet analyzer for payload-level inspection. The typical flow is spotting something suspicious here, then dissecting the exported capture in a heavier tool.


