

Rivatuner Statistics Server
About Rivatuner Statistics Server
Rivatuner Statistics Server draws numbers over a game while it runs and, if you ask, holds the frame rate to a number you choose. The first job is the on-screen display most gamers have seen in a corner of a screenshot. Frame rate and frame time, plus the temperatures and clocks fed to it by a monitoring program.
The second is the frame rate limiter that enthusiasts consider the best there is, because it paces frames evenly rather than merely refusing to draw too many. Around those two sit a frame time graph and a benchmark recorder, plus capture tools and a set of hotkeys.
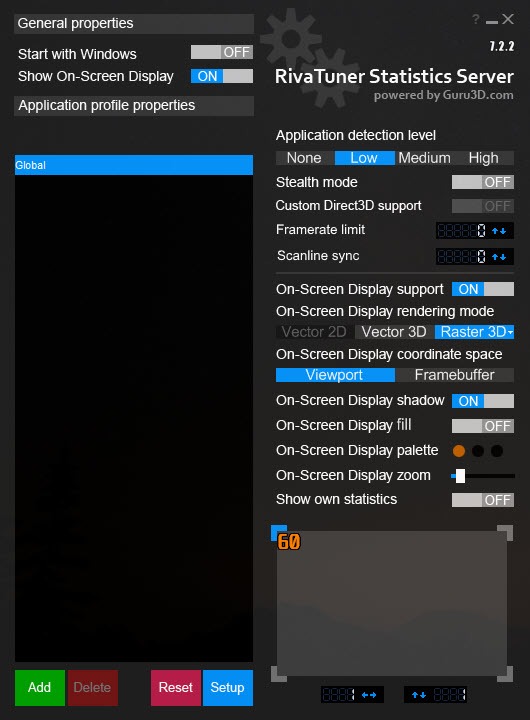
It ships inside MSI Afterburner and is installed by it, which is how most people meet it without knowing its name. On its own, Rivatuner Statistics Server is a small window with a list of game profiles and a handful of settings.
It works with any program that can feed it numbers, or with none at all. Understanding that split, the display engine here and the sensor readings elsewhere, clears up most of the confusion about what the program actually does.
What the overlay is, and where the numbers come from
The overlay is text and graphs drawn into a game’s frames by hooking the graphics API, DirectX in every version that matters, OpenGL and Vulkan. Rivatuner Statistics Server itself knows frame rate and frame time, because it is watching the frames go by.
Everything else on the display comes from a monitoring program that hands the values over. Temperature, clock speeds, fan speeds and memory in use are all supplied, most often by the program it ships with but also by others that speak its interface.
That is why a fresh standalone install shows only a frame counter. The rest is configured in the monitoring program’s own settings, where each sensor gets a checkbox for showing in the overlay. This program renders whatever it is sent.
Position, size and colour are set here, per profile, along with zoom and shadow. So is the choice between a crisp raster font and a vector one that scales with resolution, and a setting that hides the overlay until a hotkey shows it.
The frame rate limiter
Type a number into the framerate limit box in a profile and the game is held to it. What distinguishes the Rivatuner Statistics Server limiter from the one in a game’s own menu, and from the one in a graphics driver, is how it holds. It delays the start of each frame so that frames arrive at even intervals. That flattens the frame time graph and removes the stutter that comes from a game producing frames in bursts.
Players on variable refresh monitors set it a few frames below the refresh rate to stay inside the range where the display follows the game. The input box does that arithmetic for you on a right-click.
The trade is latency. Holding a frame back adds a little delay, and the program offers ways to choose where that delay goes. Front edge sync waits at the start of the frame rather than the end and reduces input lag, using processor time to do it.
On supported graphics cards the limiter can hand the job to the driver’s low-latency mode instead. A hotkey can raise or lower the cap in steps, or switch between preset caps, without leaving the game.
Scanline sync, the tear line you can move
Scanline sync is the Rivatuner Statistics Server option that gets people to install this program on a plain 60 Hz monitor. Set the frame limit to zero and enter a scanline index. The program then times each frame so that the tear line, the seam where one frame becomes the next, always falls at that row of the display. Put it in the top or bottom border and the tearing is effectively invisible. There is none of the latency of vertical sync and none of its halving of the frame rate when the game dips.
It demands headroom. The game has to render well above the refresh rate for the timing to hold. When it cannot, the tear line wanders back into view. Variants run at half or a third of the refresh rate for slower machines.
A hotkey moves the scanline index live so you can chase the seam off the screen. It is a real alternative to vertical sync on a monitor without variable refresh. It is also fiddly enough that the manual’s warning to explore it cautiously is fair.
Per-game profiles
The left column of the Rivatuner Statistics Server window is a list of profiles, one global and one per game executable, and any setting can be overridden per game. A shooter gets a tight cap and a bare frame counter.
A strategy game gets the full sensor readout and no cap. Profiles can be created by pointing at an executable, and games launched through a launcher are added by name once they have run.
Detection level and stealth mode
Two settings on each profile decide whether the overlay appears at all. Application detection level runs from none through low and medium to high, and it controls how aggressively the program hooks a process. Low catches most games. High catches games that use unusual rendering paths, at the risk of hooking things that should be left alone. Stealth mode changes the hooking method for programs that object to being hooked.
When the overlay refuses to appear in a game, raising the detection level is the first thing to try. Turning it off entirely for a profile is how you keep it away from a program that crashes with it.
Benchmarks, frame time graphs and capture
Press the benchmark hotkey and Rivatuner Statistics Server records every frame time until you press it again, then writes the results to a file. It shows the average, the minimum and maximum, and the one percent low, the figure that describes how bad the worst moments felt.
The frame time graph on the overlay shows the same data live as a scrolling line. A spike on that line is the visible form of a stutter. For anyone tuning settings, testing an undervolt or comparing two drivers, this is the evidence.
Screen capture and video capture are built in as well. The video encoder runs on the graphics card where one is available, and an option captures only the game window. The video side works, and most people use a dedicated recorder instead.
For a thirty-second clip of a stutter to send to a forum, though, it is already running.
Anti-cheat, other overlays and the crashes
Two kinds of software object to this program. Anti-cheat systems in some competitive games treat any hook into the game process as suspicious. A few refuse to start, or refuse to connect, while Rivatuner Statistics Server is running.
The fix is a profile for that game with detection level set to none, or closing the program before playing. Other overlays, from launchers, chat programs and graphics drivers, fight for the same hooks. Two of them active at once is the commonest cause of a game crashing on launch with this installed.
The hooks also mean the program needs updating in step with the monitoring program that feeds it. A mismatch produces an overlay that shows nothing or a warning on startup. Keep the two versions matched and most of the strangeness goes away.
Conclusion
Rivatuner Statistics Server is for anyone who wants to see what their machine is doing while a game runs and to make the frames arrive on time. That covers competitive players chasing a stable cap, owners of variable refresh monitors staying in range, and anyone with a plain monitor who is tired of tearing or of vertical sync. The limiter alone is worth the install.
It is not for people who want a single overlay with everything in it and no configuration, and it needs a careful hand in games with anti-cheat. Pair it with a monitoring program, keep the two in step and set the detection level per game. It then becomes the quietest and most useful thing running behind a game.
Pros & Cons
- Frame rate limiter that paces frames evenly and flattens frame time spikes
- Scanline sync hides tearing without vertical sync on fixed refresh monitors
- Overlay for frame rate, frame time and any sensor a monitoring program feeds it
- Per-game profiles with detection levels, hotkeys, live cap adjustment
- Benchmark recording with one percent lows and a live frame time graph
- Supports every DirectX version in use plus OpenGL and Vulkan
- Sensor values need a separate monitoring program to appear
- Some anti-cheat systems block games while it runs
- Conflicts with other overlays can crash games on launch
- Scanline sync needs heavy headroom and patient tuning
- Must be kept in version step with the monitoring program
Frequently asked questions
Because the frame rate is the only value the program measures itself. Temperatures and clocks and loads are supplied by a monitoring program such as the one it ships with, where each sensor has a checkbox for the on-screen display.
Add a profile for the game's executable, or select it if it already appears, and type the cap into the framerate limit box. Leave the global profile at zero if other games should run uncapped.
Raise the application detection level in that game's profile from low to medium or high. If it still fails, another overlay may be blocking it, or the game's anti-cheat may refuse hooks, in which case set the level to none and accept no overlay there.
A mode that times frames so the tear line always sits at a chosen row, ideally off the visible area, giving tear-free output without vertical sync. It needs the frame limit set to zero and a game running well above the refresh rate.
Yes. It installs and runs on its own with the frame counter, the limiter, scanline sync, benchmarking and capture all working. Only the sensor readouts on the overlay need a monitoring program to supply them.


