

ATTO Disk Benchmark
 (1 votes, average: 5.00 out of 5)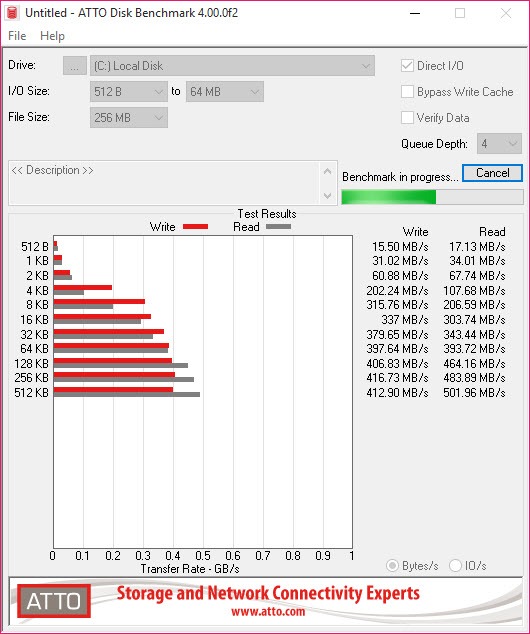
About ATTO Disk Benchmark
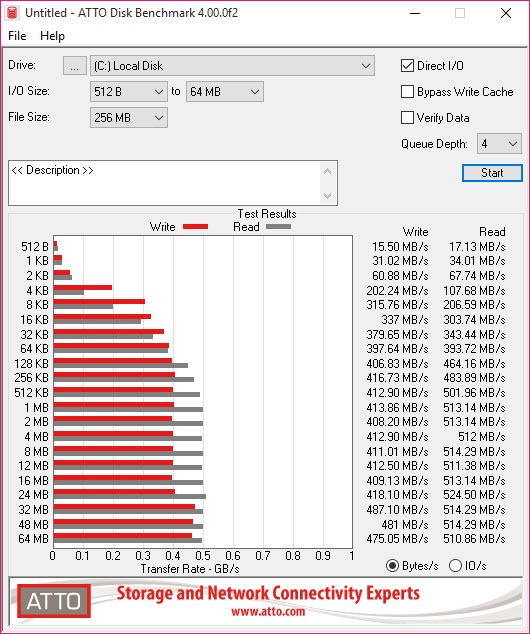
Most storage benchmarks hand you a single number and expect you to trust it. ATTO Disk Benchmark does something more useful. It runs the same read and write test repeatedly at different block sizes, from 512 bytes up into the megabytes, then charts every result side by side so you can see where a drive starts performing and where it does not.
That chart is why the tool has stuck around in storage reviews for so long. It sits alongside AS SSD Benchmark among the free testers people actually use, but the two answer different questions. AS SSD reports fixed figures including random 4K work. This one shows a curve.
The transfer size sweep, and why it is the whole point
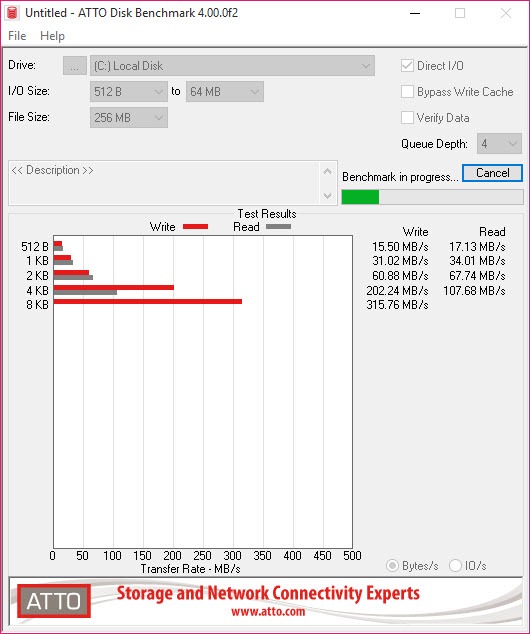
Set a starting block size and an ending one in ATTO Disk Benchmark, and the application walks every power of two between them, running a read pass and a write pass at each. The bar chart that results has a shape, and the shape tells you things a single figure cannot.
Small transfers are where the interesting failures live. At 512 bytes and 4 KB you are mostly measuring per-command overhead, interrupt handling and whatever the controller does between operations, so throughput sits far below the number on the box. Most drives only reach their advertised figures somewhere around 64 KB and above. A drive that ramps up late, or dips oddly mid-sweep, has a controller or firmware characteristic no fixed-block test would reveal.
The flip side is that the right-hand end of the chart flatters everything. Very large sequential transfers are the easiest workload any drive will ever see, and nothing you do in daily use looks like them. Read the left half of the chart with more interest than the right.
Direct I/O, overlapped I/O and queue depth
Three checkboxes change what is actually being measured, and ATTO Disk Benchmark does not hold your hand about them. Direct I/O performs the file operations with no system buffering or caching, so you measure the device rather than memory. Overlapped I/O switches to queued asynchronous operations and reveals the Queue Depth control, which sets how many read or write commands can be outstanding at once.
Combine both and you get the maximum figures the hardware can produce, which is what review screenshots almost always show. Leave Direct I/O off and you will see numbers that owe more to system memory than to the drive.
The limitation here is that each run uses one queue depth. There is no sweep across depths and no chart plotting throughput against them, so comparing a single outstanding command against thirty-two means running the test twice and lining up two screenshots yourself.
Total length, and the cache trap nobody mentions
The total length setting in ATTO Disk Benchmark decides how large a temporary file gets written to the target volume, and it is the single most consequential control in the window. Choose something small and the whole test fits inside the DRAM cache on the drive, or inside the fast SLC region that consumer drives use as a write buffer. The result is a beautiful chart that describes a cache rather than a drive.
This is why forum screenshots of the same model disagree so wildly. Somebody used a tiny total length, hit the cache, and posted a write figure the drive cannot sustain for more than a few seconds. Pick a total length several times larger than whatever cache the drive has and the numbers drop, sometimes dramatically, to what the device can actually hold.
Verifying the data, not just timing it
I/O Comparison turns ATTO Disk Benchmark into a rough integrity check. Each block that comes back gets compared against what was written, using a pattern you choose from the test pattern list, so a mismatch means something in the chain is corrupting data. Pair that with Run Continuously and you have a soak test that will happily hammer a drive for hours.
It is a useful pairing for chasing intermittent faults. A marginal cable, an external enclosure with a poor bridge chip, a drive that throttles once it heats up, all of them show up under sustained load in a way a thirty-second run never catches.
What it will not tell you is whether a flash drive holds the capacity printed on it, since the test file only occupies what you asked for. That job wants a tool built to verify flash capacity instead.
What it deliberately does not do
There is no random 4K test, no IOPS-oriented workload mix and no simulation of anything resembling a database. The sweep is sequential from end to end. For access time curves and a position-dependent read graph across the surface of a mechanical disk, HD Tune covers ground this tool never enters.
Drive health is also outside its remit. It will happily benchmark a disk that is quietly failing and report perfectly good throughput while doing it, so pair it with CrystalDiskInfo if you are diagnosing rather than measuring. The two tell you different halves of the story.
Conclusion
ATTO Disk Benchmark is for anyone who wants to know how a drive behaves rather than what score it earns. Builders checking that a new drive performs as expected, technicians hunting an intermittent fault in an enclosure, and anyone comparing a card reader against the marketing claims will all get more from the shape of that chart than from a single throughput figure.
Just do not treat it as the only measurement that matters. It says nothing about random access, nothing about drive health, and it will happily report cache speeds as drive speeds if you let it. Used with the total length set honestly and read alongside a health tool, ATTO Disk Benchmark remains one of the clearest views of what storage hardware is really doing.
Pros & Cons
- The transfer size sweep shows where a drive ramps up instead of reporting one averaged figure
- Direct I/O and overlapped I/O let you separate device performance from system caching
- Adjustable queue depth reproduces the conditions used in published storage reviews
- Non-destructive, since it writes a temporary file to a formatted volume rather than raw sectors
- I/O Comparison verifies each block against a chosen pattern, turning the run into an integrity check
- Run Continuously supports long soak tests for intermittent faults and thermal throttling
- Works on any mounted volume, from sticks and card readers to enclosures and mapped shares
- Sequential only, with no random 4K or IOPS-style workload
- One queue depth per run, and no chart comparing depths against each other
- Default total length can fit inside a drive cache and report figures the device cannot sustain
- No warning anywhere that cache effects are inflating the result
- Reports the whole storage path without helping you identify which link is the bottleneck
- No drive health information, so a failing disk can still post good numbers
Frequently asked questions
Set a total length several times bigger than the drive cache, enable Direct I/O, sweep the full size range, and note the queue depth you used. Results without those four details recorded cannot be compared against anyone else's.
Because the sweep is sequential and the large block sizes at the right of the chart are the friendliest workload a drive ever sees. Tools reporting random 4K figures are measuring something much harder.
No. Testing is non-destructive on a formatted volume, since it creates a temporary file and removes it afterwards. You do need enough free space for whatever total length you selected.
Yes, any volume with a drive letter works, including card readers and enclosures. Remember that the figures describe the entire connection rather than the drive on its own.
It depends on the total length and how many transfer sizes are in the sweep, since every size gets a full read and write pass. A multi-gigabyte total length across the whole range is a coffee break, and Run Continuously stops only when you stop it.


