

PingPlotter
About PingPlotter
The connection drops for thirty seconds during a video call, the game stutters at the worst moment, and by the time you run a speed test everything looks fine again. Intermittent network problems are miserable precisely because they leave no evidence.
PingPlotter exists to catch them in the act. It combines ping and traceroute into a continuous measurement that graphs the health of every hop between your computer and any destination, over minutes, hours, or days, so the problem that only happens sometimes finally shows up on a chart with a timestamp.
The premise sounds technical, and the underlying mechanics are, but the payoff is plain. Instead of arguing with your provider about a lag you cannot prove, you point at a graph showing exactly when the connection degraded and, more importantly, exactly where along the route it happened.
Ping meets traceroute, on a timeline
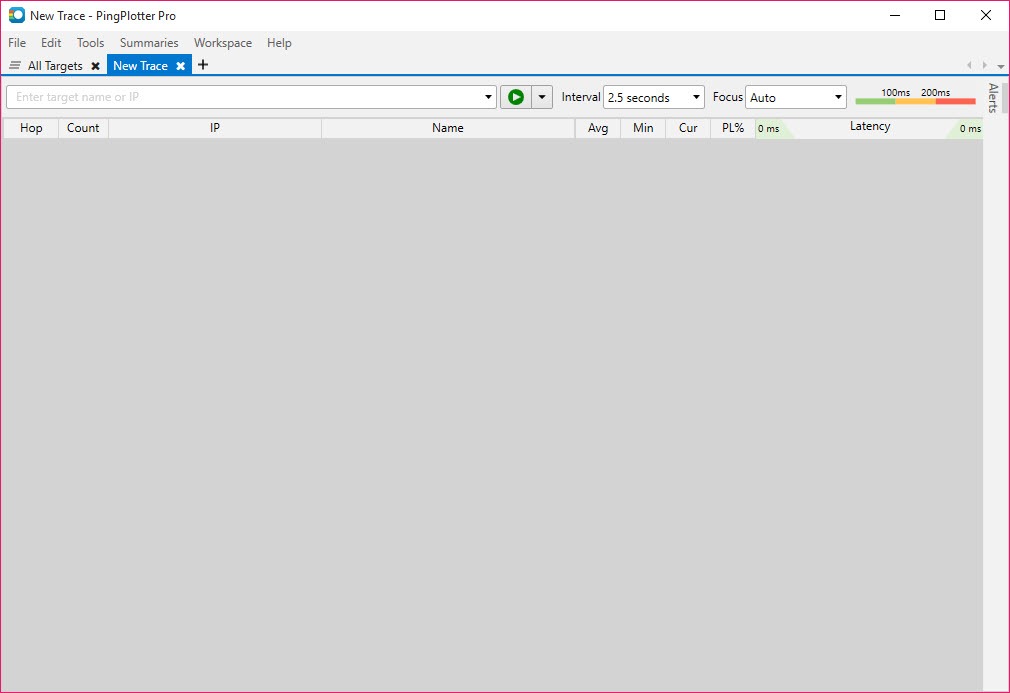
A standard traceroute shows the chain of routers between you and a server once, a single snapshot. PingPlotter runs that trace repeatedly, every couple of seconds by default, and records latency and packet loss for every hop, every round. The result is a table of the route paired with a scrolling timeline graph, and the timeline is the whole point. A single measurement tells you the connection is fine right now. A timeline tells you it fell apart for two minutes at 9:47 and recovered on its own.
Setup takes less effort than the concept suggests. Type a target, a game server, a workplace VPN address, or just a public DNS resolver, press start, and let it run in the background while you go about your day. When the stutter hits, the graph was watching.
Reading the graph, spikes and red bars
Two patterns carry almost all the meaning. Latency spikes appear as jagged peaks in the timeline, and sustained high latency shows as the whole line drifting upward, the classic signature of a saturated connection when someone starts a huge upload.
Packet loss draws itself in red, and red is what kills real-time traffic. A call can survive 100 milliseconds of steady latency, but even a few percent of lost packets turns voices robotic and games unplayable.
Where beginners go wrong is treating every red mark as a crisis. Routers along the path often answer diagnostic probes lazily, or not at all, while forwarding actual traffic perfectly, so a middle hop showing loss means nothing by itself. The rule that matters, and the one PingPlotter implicitly teaches, is that only problems continuing through to the final hop reflect what your traffic experiences.
Loss that starts mid-route and reaches the destination is real. Loss that appears at one hop and vanishes at the next is a router ignoring you, not a fault.
Finding where the problem actually lives
The hop-by-hop view turns a vague “the internet is slow” into an address. If the very first hop, your own router, already shows spikes and loss, the fault sits inside the house, usually a weak wireless signal, and a channel scanner like inSSIDer will tell you whether neighboring networks are shouting over yours.
If the first hop is clean and trouble begins two or three hops out, the evidence points at your provider’s equipment. If the entire route runs clean and only the final server struggles, no amount of complaining locally will help, the problem lives at the far end.
This triage is the tool’s real gift to non-specialists. It answers the only question that matters before spending an evening on fixes, whose problem is this, mine, my provider’s, or theirs?
Long captures, alerts, and evidence your provider accepts
Intermittent faults require patience, and the application is built for unattended stakeouts. Leave it tracing overnight or across a week, and the timeline compresses so a multi-day capture stays readable, with the bad hour easy to spot and zoom into.
Alerts remove even the watching, set a threshold, say loss above 5 percent or latency beyond 200 milliseconds, and it can notify you or log the event the moment conditions degrade.
When the case is solid, results export as images and shareable data, which changes support conversations completely. A week-long graph showing loss beginning at hop three inside the provider’s network, recurring nightly between eight and eleven, is evidence that gets escalated past the restart-your-router script. Frustrated customers have used exactly this to end months-long disputes.
Several targets, and what this tool is not
Multiple targets trace simultaneously, each in its own tab, which answers comparative questions fast. If a game server spikes while a DNS resolver stays flat, the problem is on the game’s route, not your line. Tracing both your VPN and a neutral site tells a remote worker whether the corporate tunnel or the home connection deserves the blame.
Fairness demands the boundaries be stated. PingPlotter measures and localizes, it repairs nothing, and it says nothing about which application is eating your bandwidth, a question better put to GlassWire.
It also stays at the level of routes and delays, so inspecting the actual contents of traffic remains Wireshark territory. And interpreting graphs takes a short education, which the interface supports but cannot entirely replace.
Conclusion
PingPlotter earns its place with gamers chasing invisible lag, remote workers whose calls dissolve at random, and anyone stuck in a loop of support calls that end with unhelpful advice. It converts a maddening, unprovable experience into a graph with a location and a schedule.
Nobody needs it while the network behaves. The moment something intermittent starts, though, it becomes the difference between guessing and knowing, and disputes with providers are won on exactly that difference.
Pros & Cons
- Continuous hop-by-hop tracing catches intermittent problems ordinary tests miss
- Timeline graphs pair every latency spike and loss event with a timestamp
- Route view localizes faults to your network, your provider, or the far end
- Alerts and multi-day captures run stakeouts unattended
- Exported graphs make persuasive evidence in provider disputes
- Multiple simultaneous targets isolate route-specific trouble quickly
- Diagnoses and documents, but fixes nothing by itself
- Middle-hop loss readings mislead users who skip the interpretation basics
- No visibility into which application consumes the bandwidth
- Radio-level Wi-Fi trouble needs a dedicated wireless analyzer instead
Frequently asked questions
Red segments in the timeline and a loss percentage per hop. Steady red at the final hop during your problem periods is the confirmation that packets disappeared en route.
Routers often deprioritize or ignore diagnostic probes while forwarding real traffic normally. Loss that does not continue to the final hop is a measurement artifact, not a fault.
Longer than the problem's rhythm. A nightly stutter needs at least a full evening, ideally several days, and the alert system means you do not have to watch any of it.
Yes, by position. Trouble already visible at the first hop points inside your home, trouble starting a few hops out points at the provider, and a clean route with a struggling endpoint blames the server.
No. It finds and documents the cause, which is the step every real fix depends on, but the repair happens at your router, through your provider, or not at all if the far end is at fault.


