NovaBench
 (No Ratings Yet)
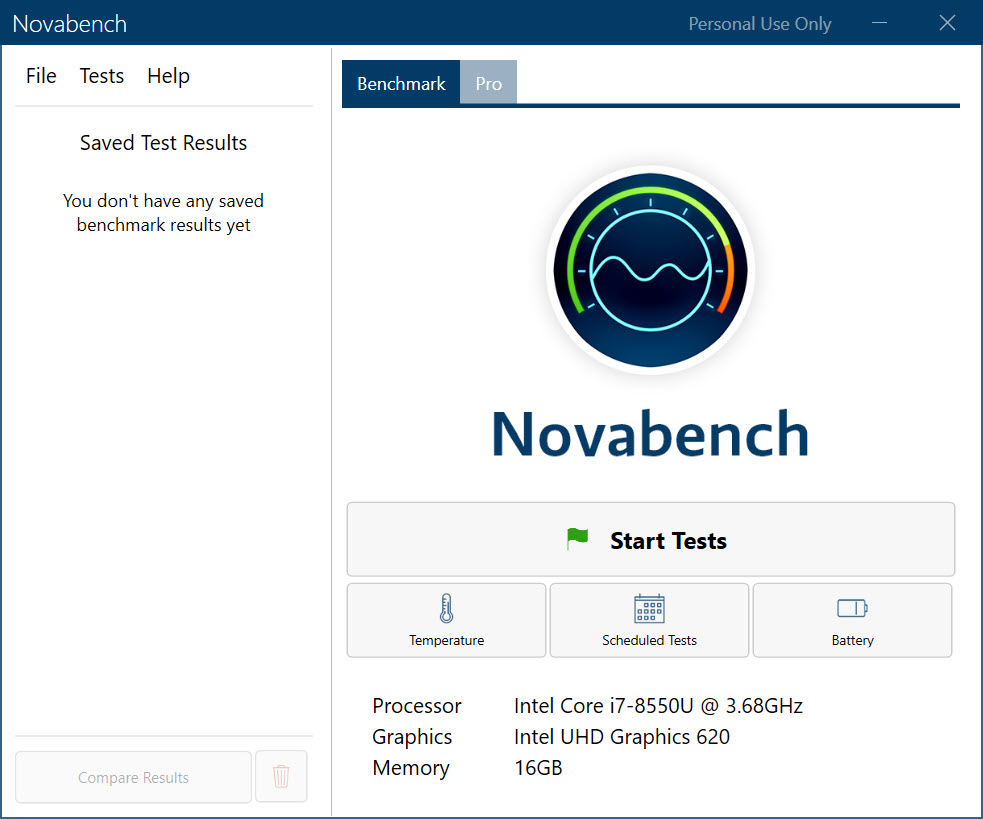

About NovaBench
NovaBench answers one question fast: is this computer performing the way it should? It runs a short battery of hardware tests, the processor, graphics, memory, and storage, and hands back a single overall number plus a breakdown for each part.
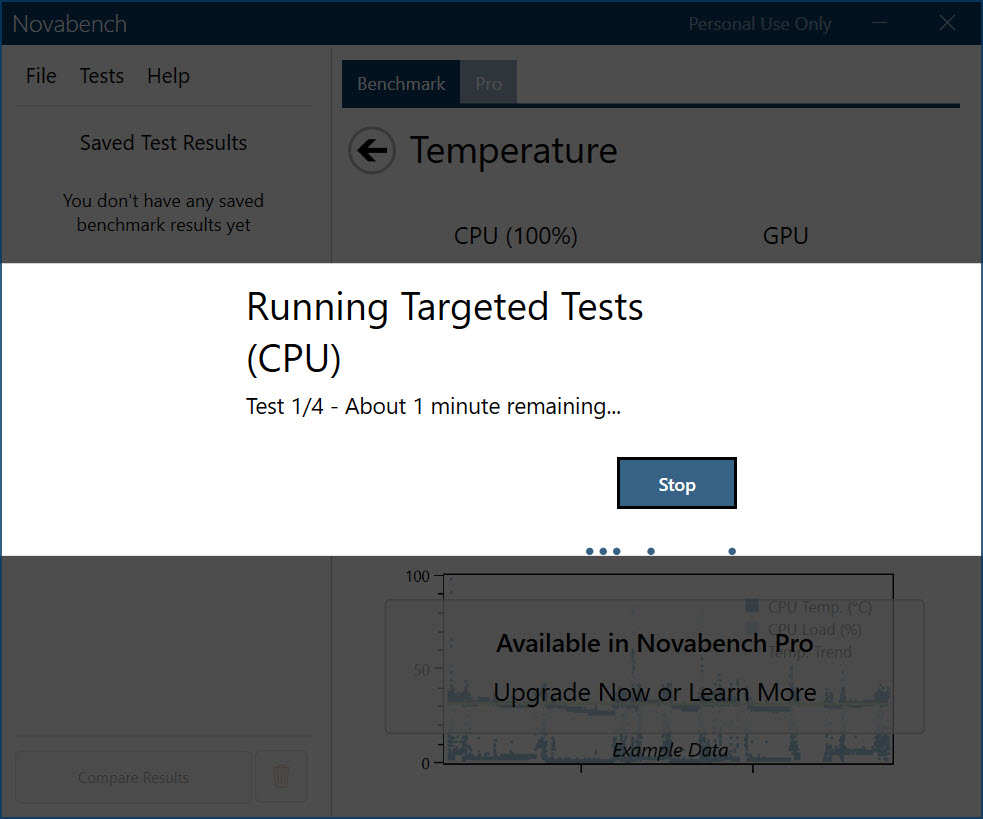
The whole sweep finishes in a couple of minutes. That speed is the entire point, and it is what separates this tool from the heavyweight suites that tie up a machine for hours.
The philosophy here is sanity-checking rather than torture-testing. NovaBench is the benchmark you reach for after dropping in new RAM, finishing a build, or trying to figure out why a machine suddenly feels sluggish.
You get a quick verdict, a comparison against a huge pool of other systems, and enough detail to spot which component is dragging the rest down. It will not push your hardware to failure the way a dedicated stress loop does, and it does not pretend to.
The component tests, one by one
Each run touches four areas, with a fifth that only shows up on the right hardware. The CPU test runs varied workloads (integer, floating-point, SIMD, hashing, compression) and reports multi-threaded and single-threaded scores separately, which matters because a chip can be a multi-core monster and still feel slow on the single-threaded tasks that drive everyday responsiveness.
The GPU test uses Direct3D or OpenCL compute work to gauge 3D and VRAM performance. The memory test is more detailed than you would expect from a quick benchmark. It measures transfer bandwidth in GB/s and profiles latency across the whole hierarchy, from L1 cache down to main RAM, and it reports whether XMP or EXPO is actually enabled. That last bit is genuinely handy. P
lenty of people run expensive memory at slow default speeds without realizing it, and NovaBench tells you straight away. Storage gets a read/write pass, and on machines with AI acceleration hardware, an NPU test measures throughput in TOPS and inference latency. No NPU means no penalty, the score is simply supplemental.
Making sense of the number
The headline NovaBench score is a single figure that rolls up weighted sub-scores from each category, with each one contributing according to how much it affects normal workloads. On its own a number like that is meaningless, which is why the comparison database is the feature that makes this tool worth using. After a run, the results screen draws a histogram for each component showing how millions of other systems scored, with your result marked as a highlighted line. You can see your percentile, compare against specific hardware configurations, and quickly tell whether your GPU is sitting where it should or trailing identical cards by a suspicious margin.
That context is the difference between “my CPU scored 4,200” and “my CPU is in the bottom 20% for this exact chip, something is wrong.” For diagnosing a bottleneck, that framing is worth more than the raw scores. A plain-language explanation feature called Novabench Explain reads your results and the comparison data and summarizes what it all means, which lowers the bar for people who do not live and breathe hardware numbers.
If you want a deeper hardware inventory to pair with your scores, a tool like CPU-Z covers the spec-reading side, and GPU-Z does the same for your graphics card.
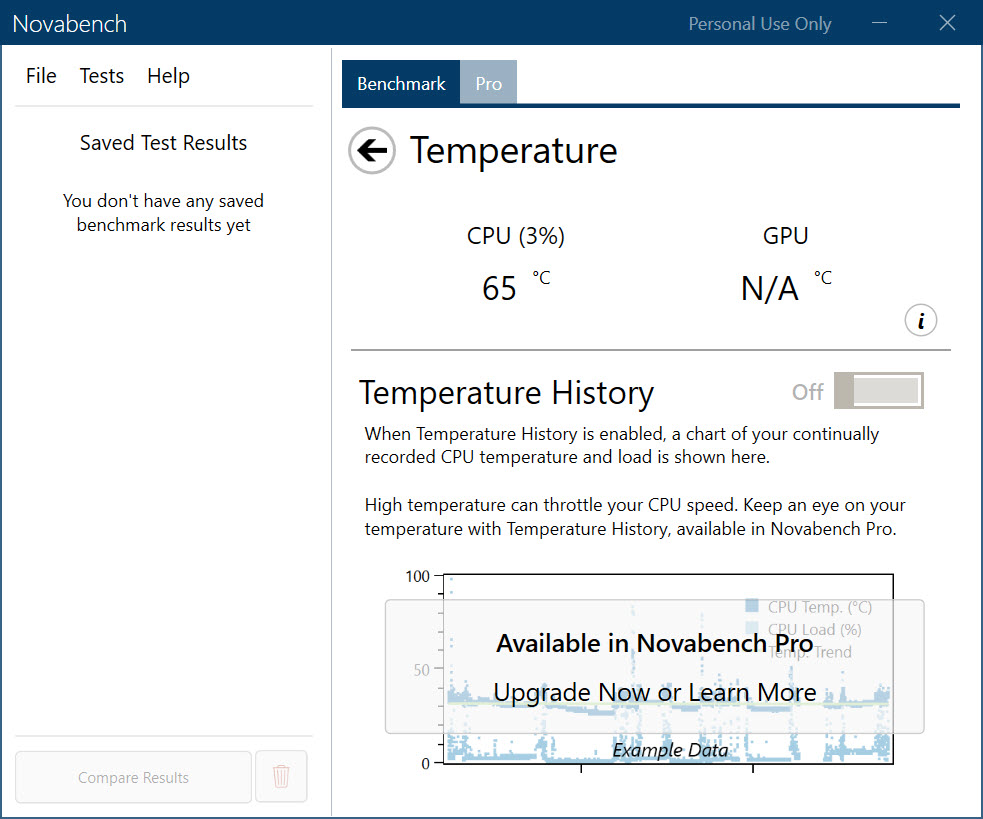
Watching the sensors during a run
NovaBench records hardware behavior while it tests, and this is where it crosses from a pure benchmark into light diagnostics. It logs temperature, clock speed, and power draw, then lets you read them against the scores. A score that drops across repeated runs while temperatures climb is thermal throttling, plain as day, and the sensor chart shows you the moment it starts.
A processor holding its boost clock the whole way through is delivering full rated performance. Unusually low power draw during the GPU test can point at a power supply problem or a power-saving mode quietly capping things.
This is useful, but it is not a substitute for continuous monitoring. If you want to watch temperatures over a long gaming session rather than a two-minute test, a dedicated tool like Core Temp or Open Hardware Monitor is the better companion. NovaBench tells you what happened during the benchmark, not what is happening all day.
Where it fits against the alternatives
The honest comparison is with the benchmarks people actually weigh it against. Cinebench makes you wait through long rendering loops and only really exercises the CPU. The graphics-focused suites like 3DMark go deep on the GPU but take their time and target gamers specifically.
NovaBench trades that depth for breadth and speed, sweeping every major component in one short pass. For an extreme overclocker validating stability over hours, it is the wrong tool. For a system integrator checking fifty machines a day, an IT tech confirming a repair, or a regular person diagnosing a slow PC, the quick full-system sweep is exactly right.
The trade is real. You will not get the granular, workload-specific precision that specialized benchmarks provide, and competitive overclockers tend to ignore it for that reason. But for a baseline reading of overall system health, very little else gives you this much information this quickly.
Conclusion
NovaBench is the right tool for anyone who needs a fast, honest read on overall system health without committing an afternoon to it. System builders verifying a fresh assembly, technicians confirming a fix, and everyday users hunting down a slowdown all get more value from a two-minute full-system sweep with real comparison context than from a specialized benchmark that measures one component in exhaustive detail.
What it does not do is replace the deep, single-purpose tools when precision matters. Competitive overclockers and anyone validating stability under sustained load will want something built for endurance.
For the far larger group that just wants to know whether their hardware is pulling its weight, the combination of speed, breadth, and a massive comparison database makes this one of the more practical benchmarks around.
Pros & Cons
- The full sweep of CPU, GPU, memory, and storage finishes in a couple of minutes
- Separate single-core and multi-core CPU scores reveal where real-world slowdowns come from
- Memory test profiles cache and RAM latency and flags whether XMP or EXPO is actually active
- Comparison database with millions of results turns abstract scores into percentile context
- Records temperature, clock, and power during tests, exposing thermal throttling clearly
- Optional NPU test for AI-accelerated hardware, with no penalty for systems that lack one
- Not built for long-duration stress testing or overclock stability validation
- Component tests are broad rather than deep, so specialists prefer workload-specific benchmarks
- Result upload can fail when a strict firewall blocks the online database connection
- Some analysis features, like the plain-English breakdown, are reserved for the paid tier
- Sensor logging covers the test window only, not continuous all-day monitoring
Frequently asked questions
It runs separate benchmarks on your CPU (single and multi-core), GPU, memory bandwidth and latency, and storage, plus an NPU test on systems with AI acceleration hardware. Each gets its own score and the suite combines them into one overall figure.
There is no fixed threshold, because a good score depends entirely on your hardware. The useful comparison is the percentile ranking the application shows against other systems with similar components. If your result sits well below identical configurations, something is holding the machine back.
Usually just a few minutes for the full sweep. That quick turnaround is the whole reason to use this software over suites that run artificial load for hours.
Yes. It logs temperature, clock speed, and power draw during the run. A score that falls across repeated passes while temperatures rise is throttling, and the sensor chart pinpoints when it begins.
This usually means a firewall is blocking the application from reaching the online database. Allowing the program through your firewall settings normally fixes the failed result submission.